US Bank’s new cryptocurrency service is a safekeeping custody solution for institutional investment managers. The new offering’s launch exhibits the banking and financial services company joining other firms of the same type entering the cryptocurrency space. We are quite eager to learn and share this virtual currency-related report with our
Weekly Crypto Analysis by Crypto Frontline
BTCUSD (Coinbase) The Bitcoin sentiment improved at the end of last week and now the price trades close to $48,000. It formed a base around $41k and since then edged higher impulsively, suggesting there might be scope for more gains in the days ahead. However, the first resistance level needed
BTCUSD (Coinbase) More choppy activity can be noticed in Bitcoin. The token managed to recover from the lows around $40k, but all gains were wiped out after China deemed all crypto operations illegal. Now we see the price rebounding, yet the structure continues to tilt in favor of sellers. They
BTCUSD (Coinbase) As we’ve anticipated a week ago, Bitcoin bounced from the lows but failed to keep the gains. This week starts with massive selling across the board, as financial markets are digesting a potential default of Evergrande, one of the largest Chinese real estate developers. From a technical standpoint,
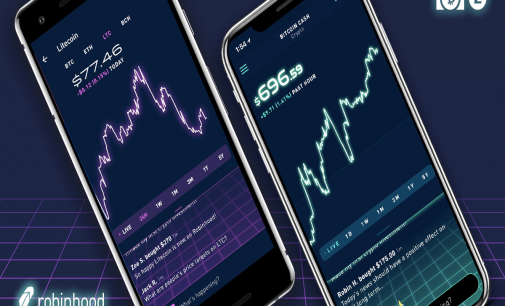
Robinhood is launching a new recurring cryptocurrency investment feature this month. Find out more about this trading platform’s new offering here.
BTCUSD (Coinbase) Bitcoin becoming legal tender in El Salvador turned out to be a major “sell-the-fact” event, considering the price plunged back below our key area around $50k. Since it breached below the 20 EMA and 200 SMA on the 4h chart, the move up is now under question. The
BTCUSD (Coinbase) Bitcoin buyers are still holding the upper hand and have new reasons to continue actively buying, considering the price managed to break above the $49k – $50k key resistance area. The new week comes in hand with additional gains, as BTC is now trading above $52k for the
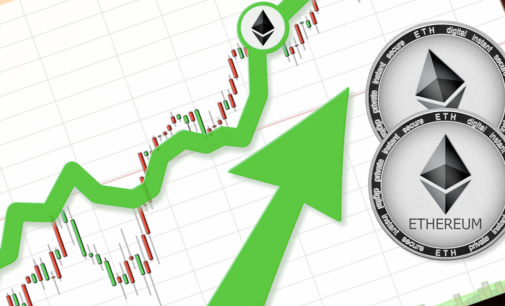
Ethereum’s trading price surged by almost 5 percent during yesterday’s trading session, September 1. For the first-ever time since May 15, 2021, the world’s second most valuable cryptocurrency crossed the trading price level of US$3,500. We feel elated to read this latest development about Ethereum. We think it is among
BTCUSD (Coinbase) The $50k area turns out to be a stronger resistance for Bitcoin buyers as the price failed to break and hold above it. BTC is trading a little over $48k now that September is near and due to month-end flows, some profit-taking should not be ruled out, after
BTCUSD (Coinbase) The past week saw Bitcoin treating the daily 200 SMA as support and that is an encouraging sign moving forward. We can see the price reached the resistance area highlighted a week and some hesitation from the buy side, but it could also be due to the reduced


