
BTCUSD (Coinbase)
Source: TradingView
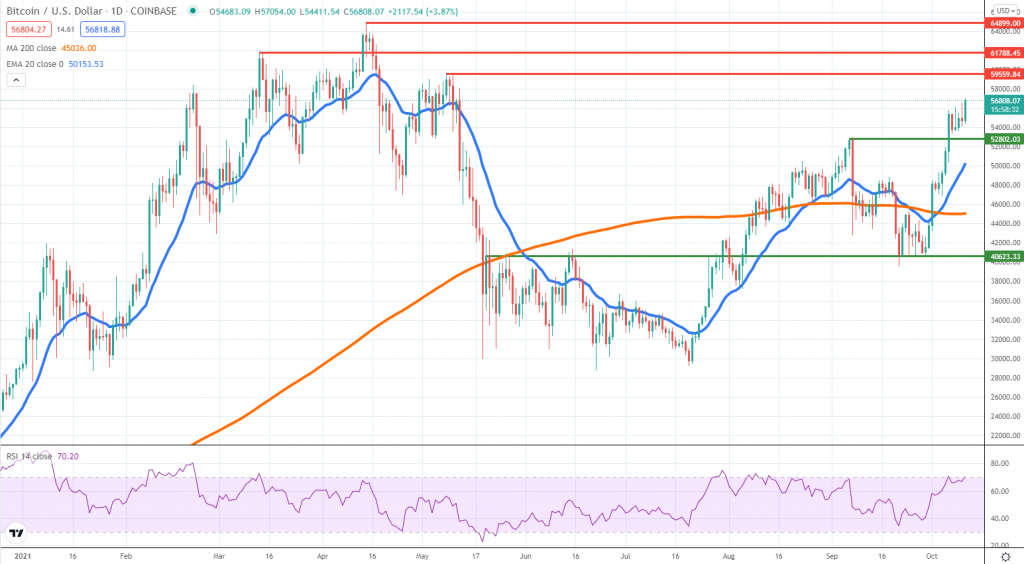
Bitcoin continues to march higher and now trades at levels not seen since early May. Once the price broke above the September 7th high located near $52.8k, buyers have gathered momentum and now are on track to threaten the area around the all-time highs.
Trading close to $57k, the next key zone to watch is around $60k. On top of being a psychological area, it is also a place where sellers have been active when the May crypto rout started to unfold. Breaking above that area will mean $62k and the all-time high will be next in line.
We can see a divergence away from the stock market’s performance. Major indices remained choppy as high inflation prospects on the back of energy prices, monetary stimulus winding down, and a rising USD were capping the upside momentum.
That does not seem to be the case with Bitcoin, but still, technicals should be monitored for a weakening bullish strength. A break back below the $52.8k will be an early sign, while if the price fails to remain above the daily 20 EMA, BTC is bound for a deeper move lower. The RSI is now overbought on the daily chart and traders should keep an eye on it.
ETHUSD (Kraken)
Source: TradingView
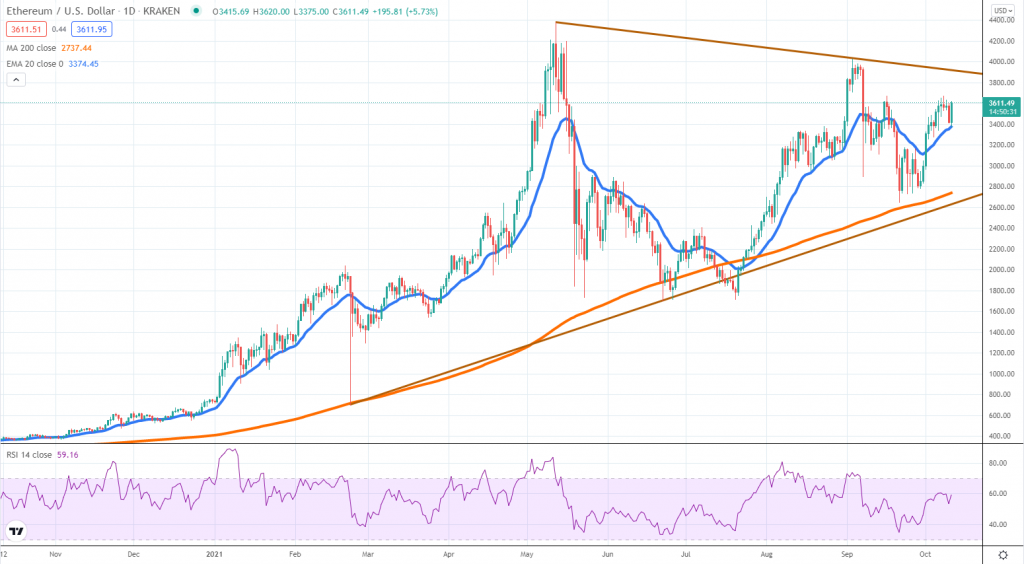
In the case of Ether, a major technical breakout did not occur yet, which keeps the token in consolidation mode. The price is trading inside a triangle channel and as the sentiment is mildly tilting in favor of bulls, there is scope for some more gains towards the $3.8k – $3.9k resistance area.
On a breakout outside the triangle, the next area to watch would be the all-time high and then $4.5k. However, we advise caution as the top of the triangle can turn out to be a strong resistance and sellers should be very active there.
For the time being, we think the price will continue to trade inside the structure, which makes a corrective move more likely. If ETH breaks below the daily 20 EMA, watch for a continuation lower towards the 200 SMA and the lower line of the triangle.
SHIBUSD (Binance)
Source: TradingView
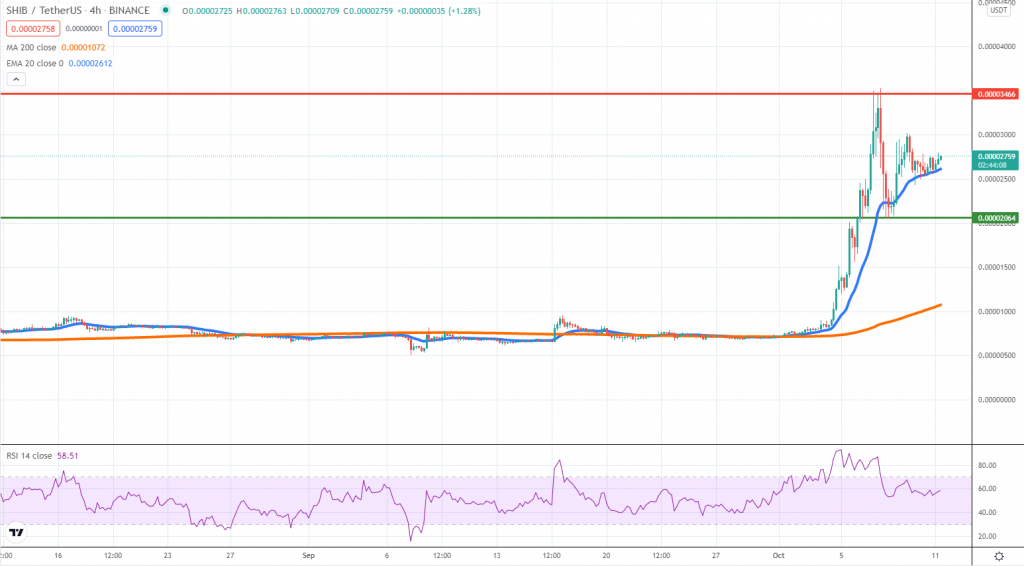
Shiba Inu has been back in the spotlight during the past week, as it currently posts a 7-day gain of 224%. On the 4h chart, the bulls have taken a break, but the downside has been capped by the 20 EMA. As long as that will hold, we think the price can retest the 0.00003500 area of resistance, which is where the current leg up stalled.
On a break below the 20 EMA, expect more weakness that could push the price lower, right around 0.00002400. Gains have been massive and now we should not exclude a period of choppier activity. That is why we think SHIB will remain inside this range for the next couple of days. A breakout on either side will be a sign of order flow imbalance and more follow-through will be very likely.


There are no comments at the moment, do you want to add one?
Write a comment