
BTCUSD (Coinbase)
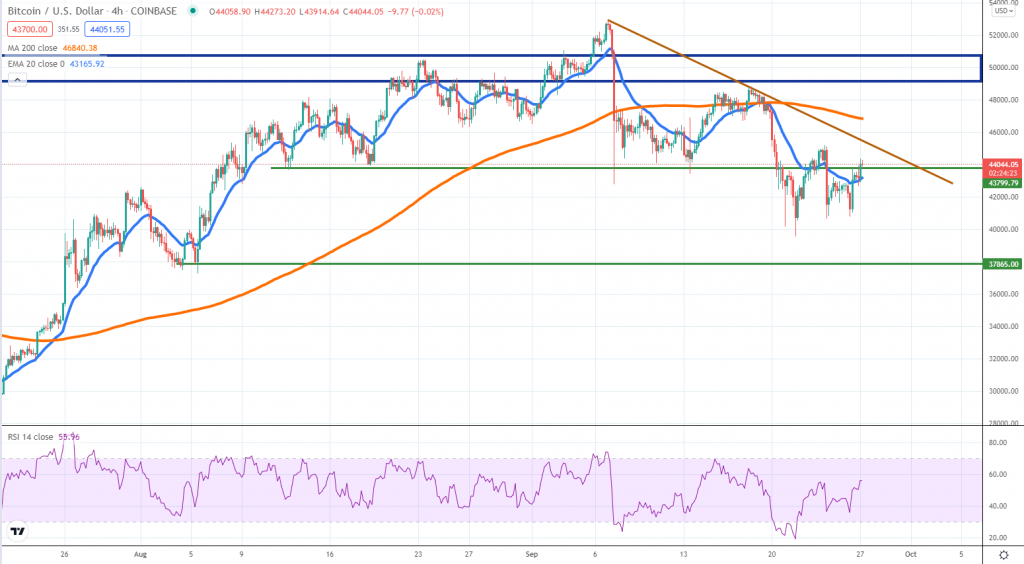
Source: TradingView
More choppy activity can be noticed in Bitcoin. The token managed to recover from the lows around $40k, but all gains were wiped out after China deemed all crypto operations illegal. Now we see the price rebounding, yet the structure continues to tilt in favor of sellers.
They would need to break above a falling trend line and the 4h chart 200 SMA to show that the trend reversed in the short-term. The RSI is pointing upward and that is encouraging to start the new week.
Relief can be spotted across all financial markets, with stock markets edging higher after an impulsive selloff. If that will continue to be the case in the following days, Bitcoin might be able to recover some of the losses.
In case the sellers resume and $40k will fail to provide support, expect the move lower to extend towards the $38k area. That is where the August lows are located and buyers could attempt a rebound.
ETHUSD (Kraken)
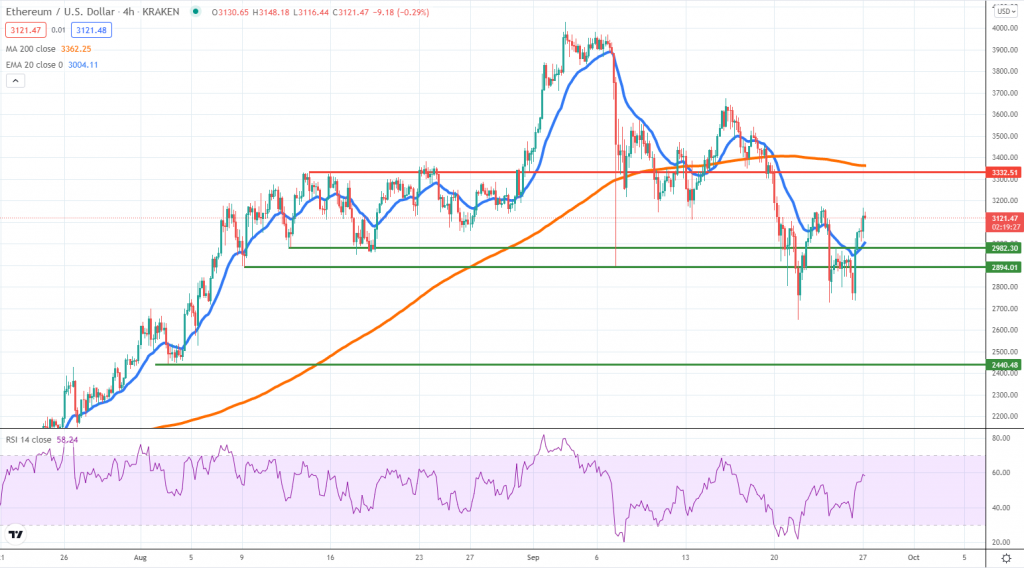
Source: TradingView
Despite breaking below the key area around $2.9k – $3k, Ether is in a much promising position as compared to Bitcoin, mainly because the buyers show better strength. With that in mind, we are optimistic the price can continue to recover if the risk sentiment persists and the first resistance area to watch is located around $3.3.
That would be a critical zone, especially since the 200 SMA is also near it. Sellers could resume, putting some pressure on buyers. However, if bulls end up winners, the price can further extend towards $3.6k.
We should remain cautious until further developments point to stronger buying interest. Despite the short-term recovery, ETH broke below key support levels and that could incentivize sellers to sell the rips.
The series of lower higher and lower lows continue and until that changes, we remain slightly bearish on ETH. It would be critical to see if the market manages to brush aside regulatory concerns.
BNBUSD (Binance)
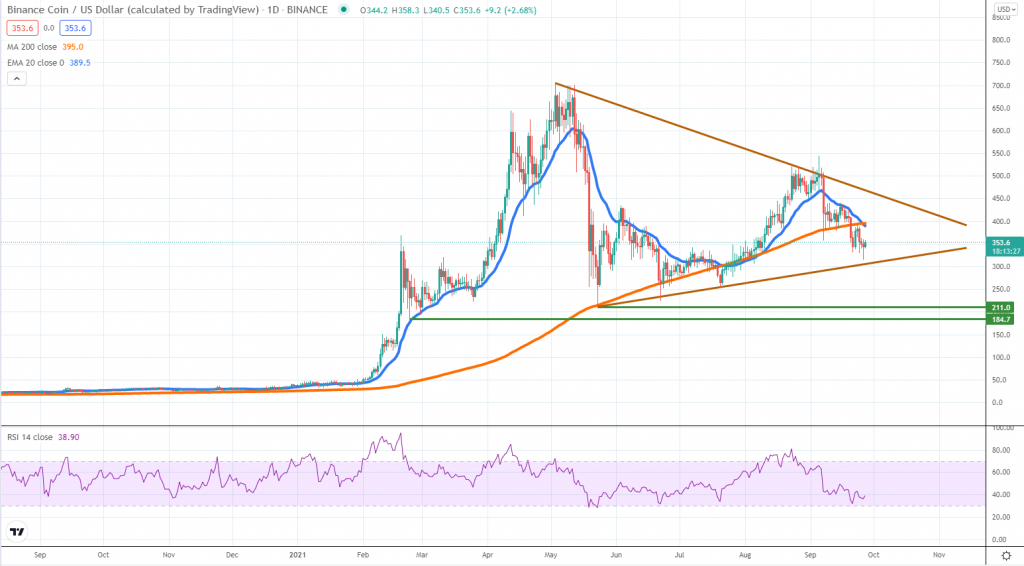
Source: TradingView
Based on how Binance Coin is performing the sentiment of indecision in the market is justified. When BNB is rising impulsively, that is a sign of strengthening momentum, given new market participants are getting involved. That is not the case right now as the price is trading inside a triangle formation, with no directional bias.
Until the structure will be broken, traders can play both sides. Volatility is dropping and that creates a proper environment for those with lower risk tolerance. The price is already showing signs of strength after almost touching the lower line of the structure, suggesting there is buying interest there.
A breakout on the upside will be needed to confirm the bullish trend resumed and BNB can attempt a retest of the all-time highs around $700. Breaking on the downside will put further pressure on the $200 area and might suggest this is a large bubble that will continue to burst.


There are no comments at the moment, do you want to add one?
Write a comment