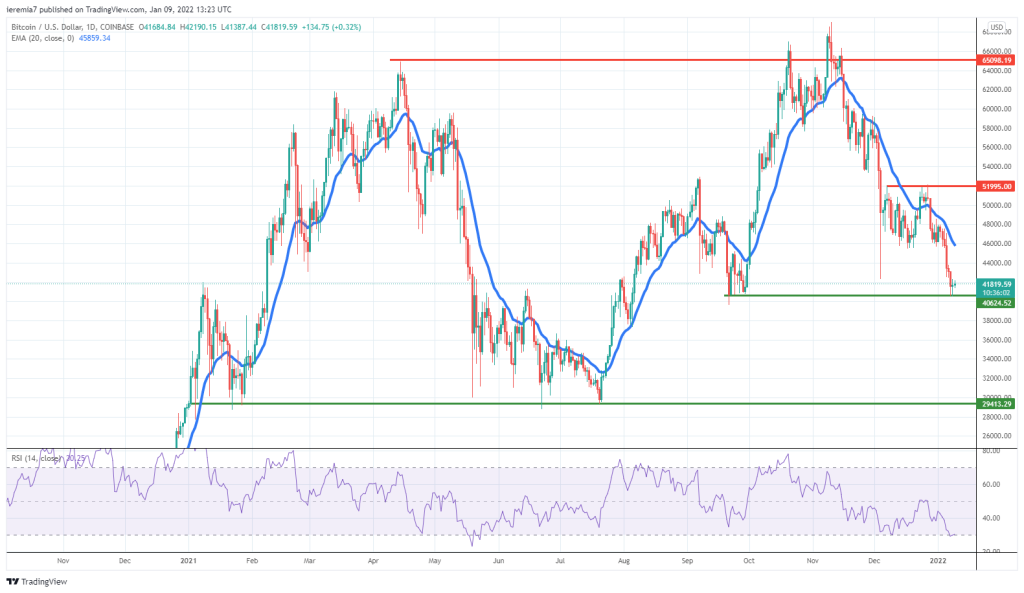
BTCUSD (Coinbase)
Source: TradingView
As we’ve anticipated, the Bitcoin selling continued to strengthen and the price reached the December 4th spike. Although some balancing occurred near $40,500, it’s not enough thus far to suggest the sentiment is shifting in favor of buyers.
On the contrary, during the past week, we’ve witnessed an acceleration of the bearish sentiment and that does not bode well heading into the second week of January. Looking at the bigger picture, Bitcoin is trading inside a large range between $65k and $29.5k.
The $40k psychological area is the only barrier in front of sellers in the near term and if cleared, it could open more room towards the bottom of the structure. We continue to believe the bearish sentiment will keep BTC subdued, which is why this is not the time to buy.
However, even if our forecast will materialize, there is scope for pullbacks on the upside. We can see on the daily chart the market treated the 20 EMA as resistance and that could happen again if the price gets back up. The RSI is close to the oversold territory which is another argument to not rule out a correction higher.
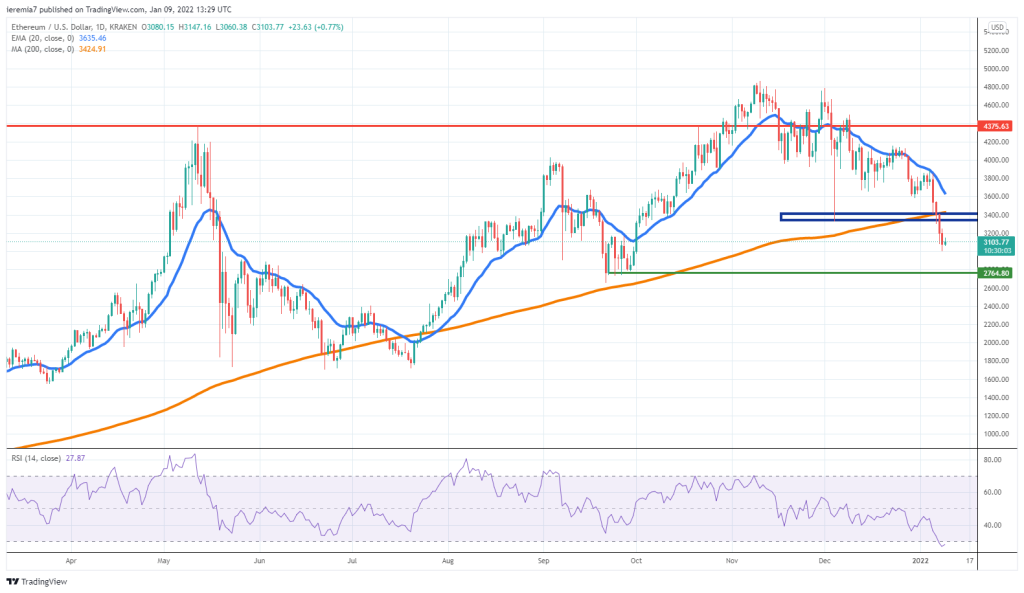
ETHUSD (Kraken)
Source: TradingView
All cryptocurrencies are under pressure and Ether is not an exception. The price broke below the daily 200 SMA and the December 4th low, a strong sign of heavy selling. With that in mind, it’s now important to see for how long the price will trade below the SMA.
We can notice back in June 2021 that there was a bottoming formation around the orange line and the price picked up steam despite a temporary breach below. However, the price action structure is slightly different now, considering the selling is very impulsive, suggested by the four consecutive red candles on the daily chart.
The areas to watch on the upside are $3.4 and the 200 SMA, followed by the 20 EMA. Sellers might target the $2.7k support, a swing point where there was buying activity in September 2021.
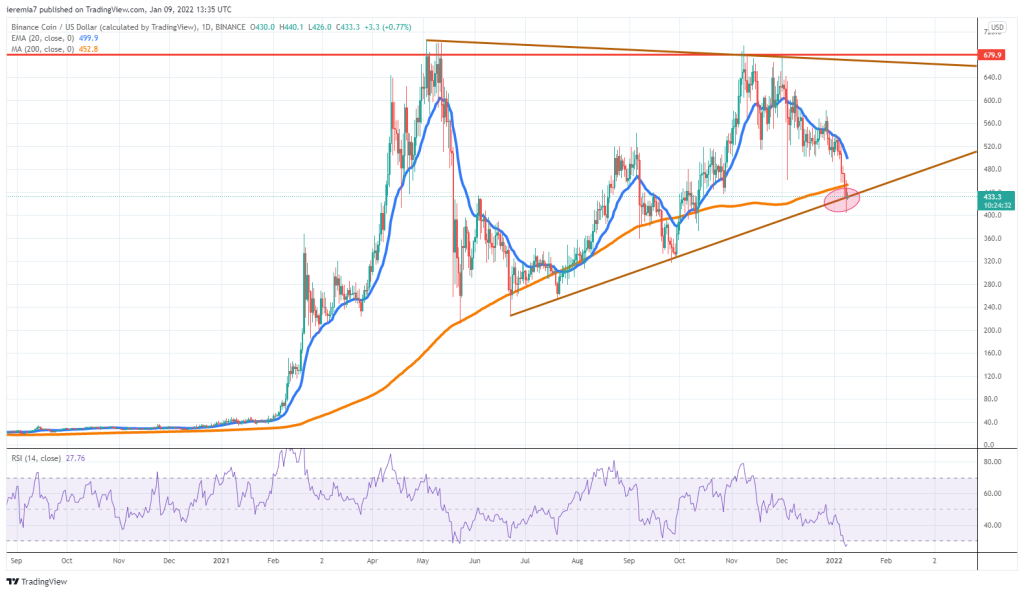
BNBUSD (Binance)
Source: TradingView
Binance Coin is at a crossroads, given the price reached an ascending trend line going back to June 2021. On prior occasions, buyers were strong enough to stage a robust rally after touching the line and the question remains whether it could happen again.
An encouraging sign is that even though the price briefly dipped below the trend line, buyers managed to push the price back above it. Still, follow-through buying is necessary to incentivize more buyers to step in. If that happens, watch if the market starts treating the 200 SMA as resistance. It could indicate the sentiment shifted and a breakout lower very likely.
In case the price starts to trend higher, away from the trend line, buyers might have the upper hand in the short run. This is a possibility, considering the oversold conditions on the RSI. The bearish sentiment is not limited to crypto, as tech stocks are also selling off, which is why we remain overall bearish in the following week.


There are no comments at the moment, do you want to add one?
Write a comment