
BTCUSD (Coinbase)
Source: TradingView
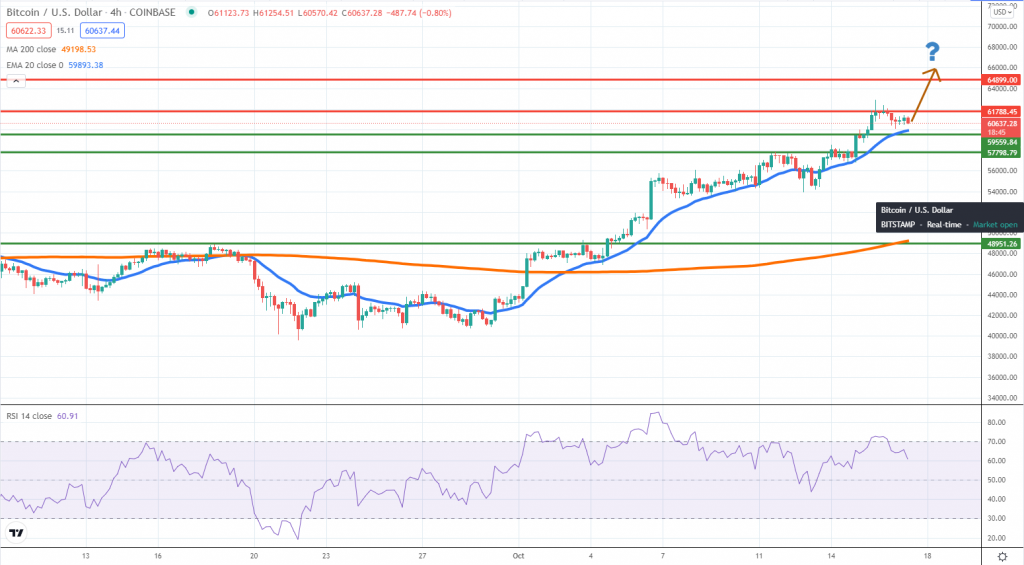
The Bitcoin bull run continues on the back of positive expectations related to an ETF being launched in the USA. Since the event could occur over the next few days, the market is expected to build up momentum, which is why we suspect there could be a retest and even breach above the current all-time high.
Two of the targets we’ve mentioned a week ago have been reached and now the price is consolidating little above the 20 EMA on the 4h chart. We expect to see support around $60k and then a resumption of the bull move as the new week starts and activity picks up steam again. Regardless of the underlying reasons, traders should monitor technicals carefully as this is a very sensitive market.
A breakout below $60k might open some downside room towards $58k. However, nothing seems to be stopping the buyers at the time of writing, which makes a counter-trend approach unfit. Watch closely for any “buy the rumor, sell the fact” situations, in case the market will start to weaken once the ETF is announced, or if the news fails to materialize.
ETHUSD (Kraken)
Source: TradingView
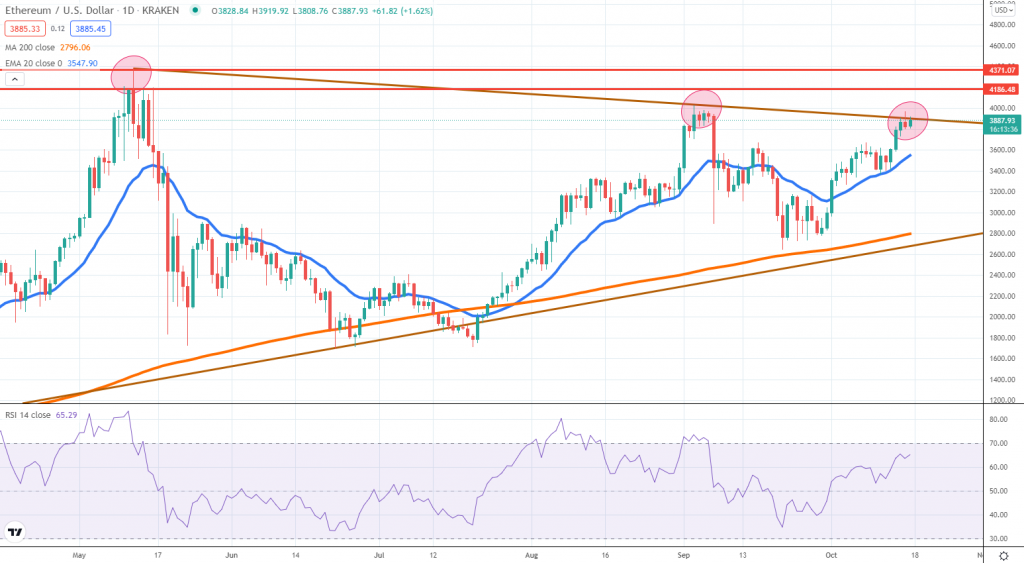
Ether also managed to edge higher, driven by the positive Bitcoin momentum. However, the price action is now struggling around the upper line of the large triangle formation, which puts any directional bias on hold until further clues arise. We can see a pinbar on the daily chart and that shows there is still selling interest around the area.
In case the price makes a new weekly high and negates the price action candle, then ETH has a free way towards the psychological $4k area. We expect more selling interest to emerge around $4.2k and near the all-time high.
It is difficult to make assumptions at this point since it all depends on whether the triangle will continue to hold or not. Stronger selling will mean a corrective move might start to unfold, while a break will be the sign required to keep the buyers motivated.
BNBUSD (Binance)
Source: TradingView
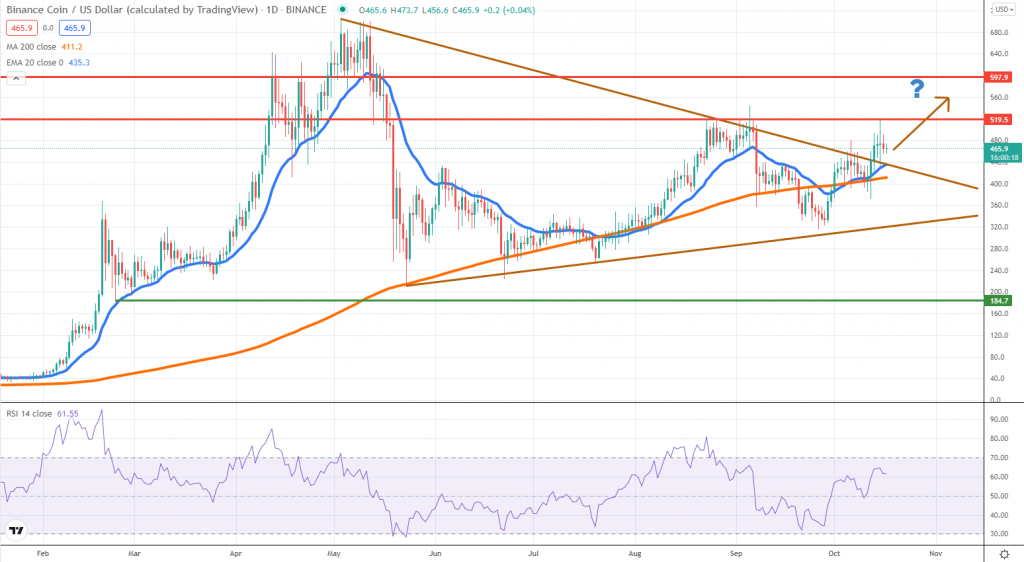
Similar to ETH, Binance Coin has also been trading inside a triangle pattern, but now we see the price managed to break above it, which leads to weaker selling interest. The market already retested the upper line of the structure and now the most probable outcome is a continuation higher.
If the price gets past the resistance around $520, that will be an early sign for a push higher, towards $600, where our next upside target is located. As the broad market continues to edge up, BNB is one of the tokens to benefit, since Binance remains one of the exchanges with a large number of customers.
On the negative side of things, it would be important to note the price move above and below the daily 200 SMA, which is not a sign of strength. A break above the September high is necessary to change the current technical picture.


There are no comments at the moment, do you want to add one?
Write a comment