
BTCUSD (Coinbase)
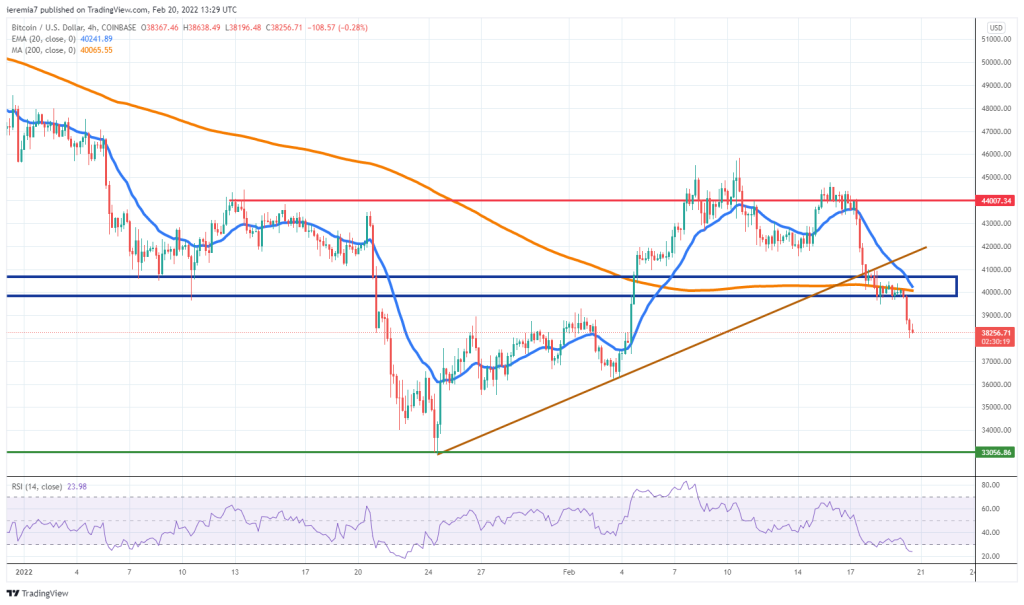
Source: TradingView
Bitcoin’s technical picture is eroding considering the price broke below a confluence of support areas. An ascending trendline, the 4h chart 200 SMA, and the key support level near $40k were not able to contain the selling pressure.
As a result, we now see the price dipping, in what could be a risk-defensive move, triggered by a high uncertainty in Eastern Europe. If tensions persist and no resolution is found, there could be more pressure mounting on BTC and $33k might be revisited. Breaking lower will unlock more downside potential towards $30k, another key support area discussed in the past.
We believe the market sentiment will remain dependent on headlines related to Ukraine, so traders need to be flexible enough to expect even a re-break above the levels previously mentioned, which will put the bullish momentum back on track. If a full-blown war is avoided, market participants should brush tensions aside. For now, there’s a game of “he said, she said” ongoing, with both sides accusing each other of incidents at the border.
ETHUSD (Kraken)
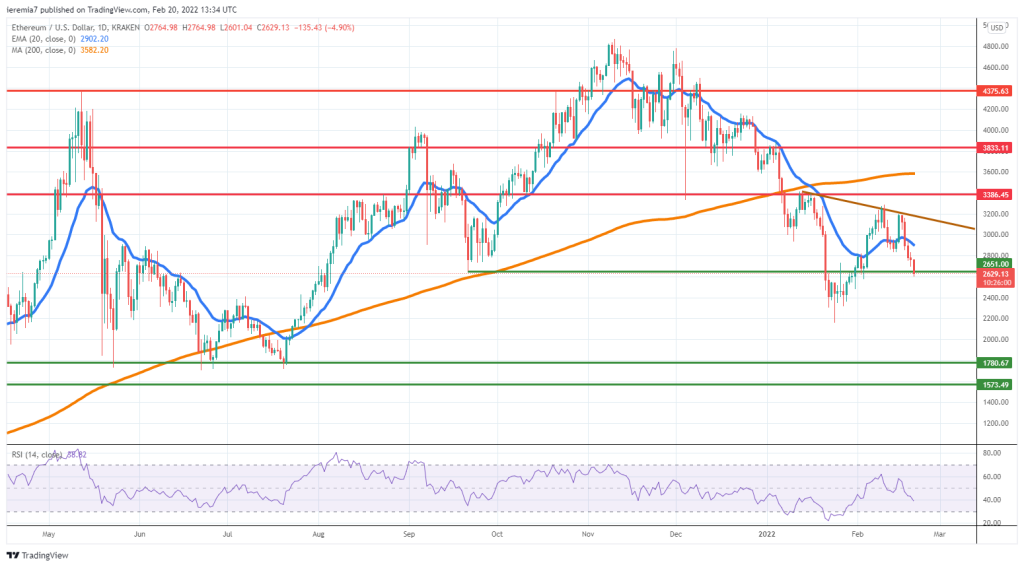
Source: TradingView
Despite breaking and holding a short span above the daily 20 EMA, Ether was also influenced by the current broad crypto selloff and now struggles to break below $2,6k, an important swing area. A continuation lower will signal more pain ahead, as the price can retest the January lows and continue to push below the $2k mark.
In the past, we’ve highlighted the $1.8k support, which remains valid even today. The bigger price action picture continues to favor the bulls. Unless the price breaks above $3.2k and there’s follow-through buying, sellers will hold the upper hand and shall continue to erode the gains.
If the price does break above $3.2k, watch to see how it reacts around the daily 200 SMA. For a consistent amount of time that line has been treated as support and now that the markets spent more time below it, we are technically in bearish territory.
BNBUSD (Binance)
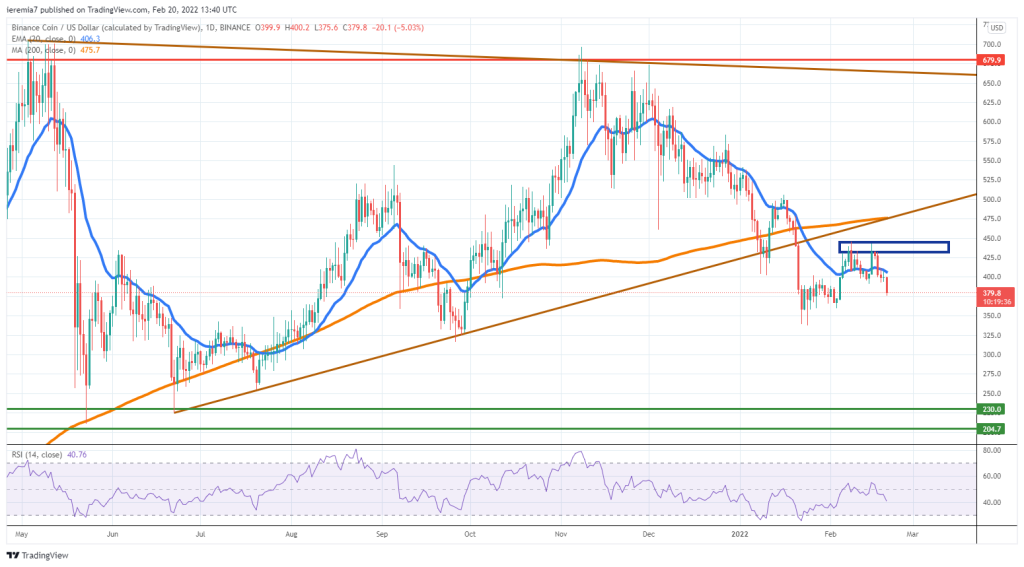
Source: TradingView
Since Binance Coin breached below a major triangle pattern, buyers were not able to stage a consistent move up. As we can see from the chart, the correction stalled around the daily 20 EMA and now BNB is under pressure again.
We continue to stick with our past forecast, believing the token can weaken further, potentially heading towards $230 in the mid-term horizon. But first, an early confirmation for that happening would be a break below the January lows. That will mean the market generated a new lower low, confirming the bearish conditions.
On the other hand, a break above $440 is necessary so BNB can stage a more robust recovery. But even in that scenario, we need to break above the daily 200 SMA and also inside the triangle. We suspect heavy selling in case the price will manage to retest the broken structure. Overall, the bullish scenario has a lower probability to occur, which is why we choose to stick with our bearish tilt.


There are no comments at the moment, do you want to add one?
Write a comment