
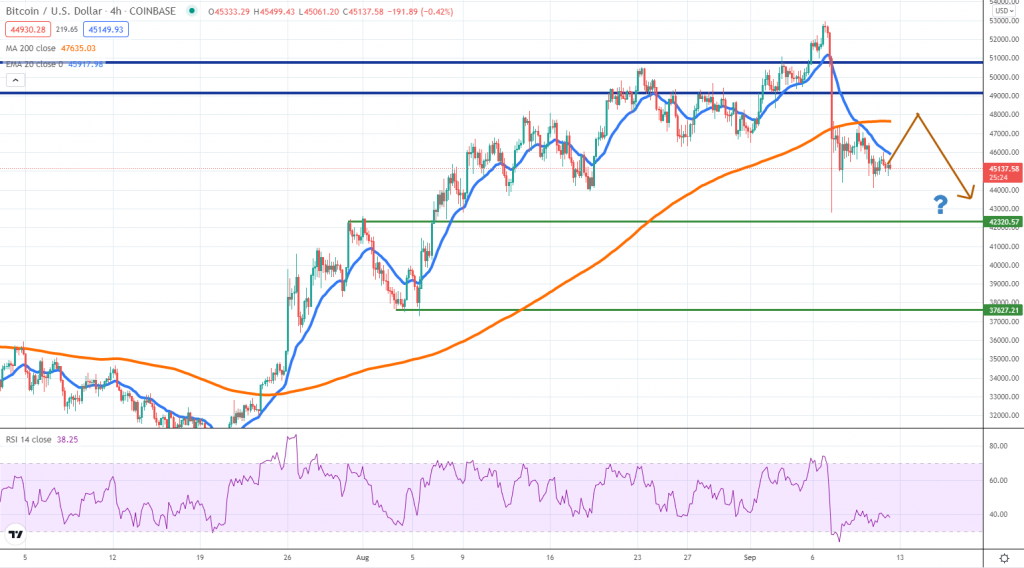
BTCUSD (Coinbase)
Source: TradingView
Bitcoin becoming legal tender in El Salvador turned out to be a major “sell-the-fact” event, considering the price plunged back below our key area around $50k. Since it breached below the 20 EMA and 200 SMA on the 4h chart, the move up is now under question.
The 20 EMA is treated as resistance and that does not bode well for the sentiment heading into the new week. We think there might be a pullback higher but sellers could treat it as an opportunity to get short again. The sentiment across the financial industry is not supportive, as well since stock markets are retreating from highs.
As a result, Bitcoin is vulnerable over the upcoming days and the first support area to watch is located around $42k. Further weakness below it could be an early indication that selling might not ease until $38k will be reached. If the price action posts new lower lows and lower highs, the sentiment will continue to favor sellers and Bitcoin’s weakness might have another leg to go.
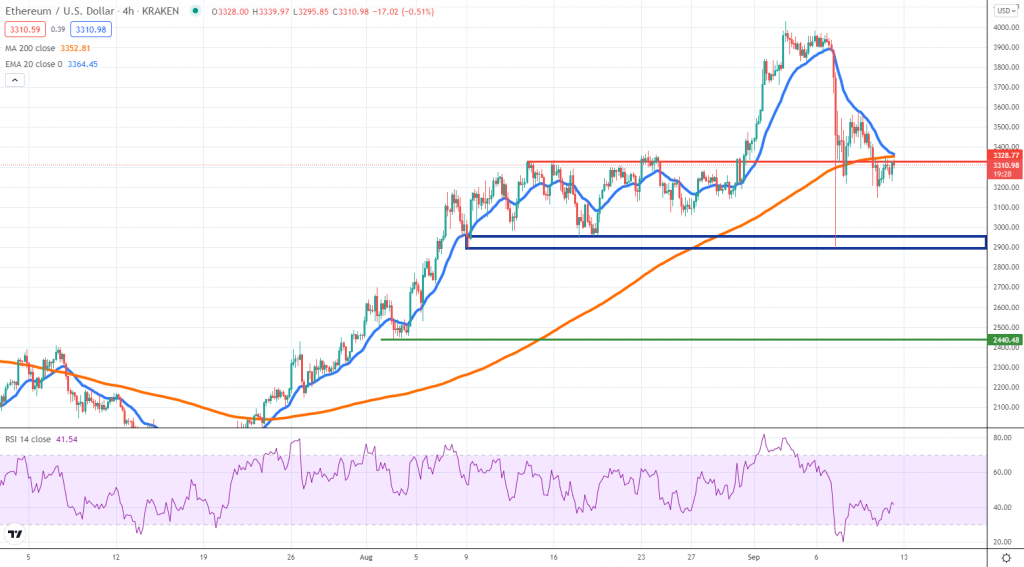
ETHUSD (Kraken)
Source: TradingView
Similar to Bitcoin’s performance, Ether was also subject to heavy selling over the past week, only this time of speculation that the DeFi, in particular, NFT bubble might burst. Since most of the NFTs are based on the Ethereum blockchain, this token benefited from large inflows. As things are starting to reserve, a violent move lower emerged.
We see the spike stalled around $2.9k, where a key support area is also located. Even though the price retraced higher, it failed to show consistent gains and that is why we suspect there could be room for more selling heading into the new week.
A retest of the $2.9k is now very likely and only if buyers managed to cap the downside, should we expect a bottoming formation to occur. A continuation lower will open more room on the downside towards $2.5k.
At the time of writing, ETH a tough of war is going on around the 4h chart 200 SMA. If buyers manage to win in the short term, then $3.5 could be revisited.
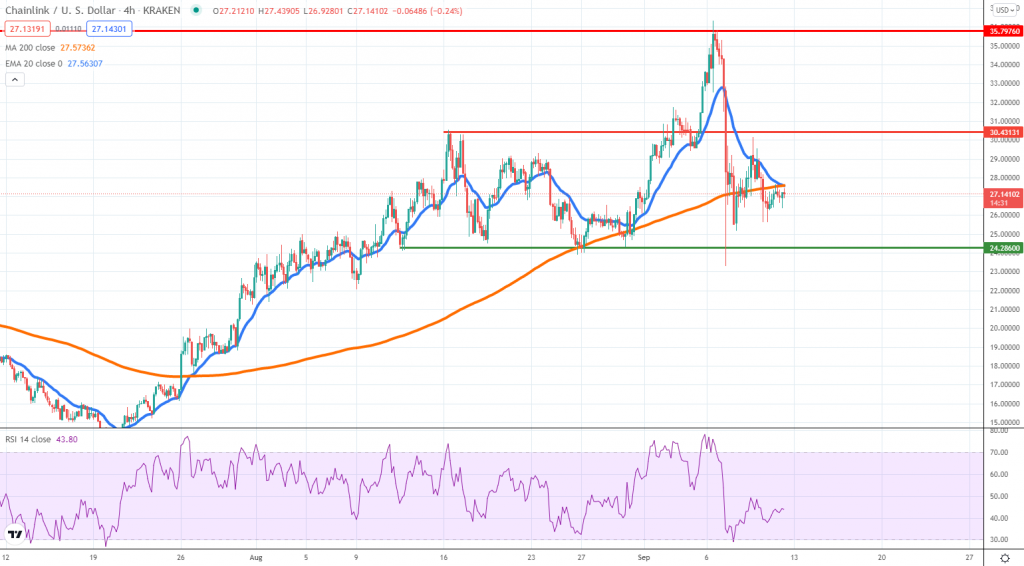
LINKUSD (Kraken)
Source: TradingView
Chainlink has not been spared by the wave of selling that engulfed the entire crypto market. The price found a temporary top around $35 and then dropped to $24 before finding bids. Looking at the 4h chart, this could be the early stage of a larger head and shoulders pattern.
The neckline is at $24 and the shoulder top is at $30. With that being the case, there could be selling interest in case LINK manages to rebound towards $30. If the setup turns out to be legit, the technical picture will imply all gains since August might be erased.
Central banks slowly hinting at tapering, rising Treasury yields, and signs of topping in the global economy are thus far creating headwinds for the crypto sector. DeFi is thriving during times of elevated risk sentiment, which is why investors are getting out of LINK now.


There are no comments at the moment, do you want to add one?
Write a comment