
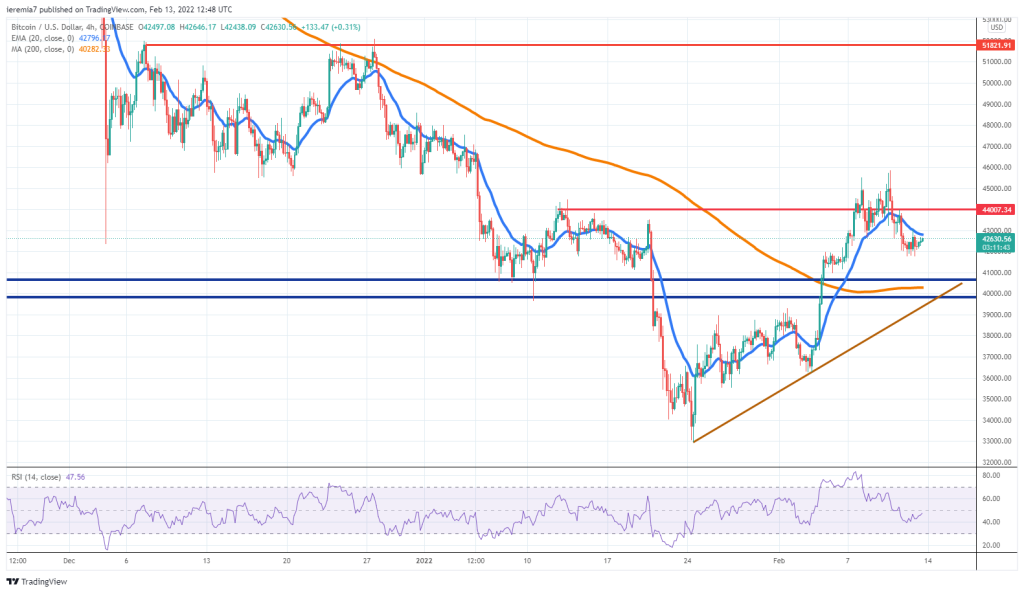
BTCUSD (Coinbase)
Source: TradingView
Late on Friday news broke out related to escalating tensions in Ukraine, which prompted a flight to safety across the entire financial markets. Unfortunately for Bitcoin enthusiasts, this asset did not act as a safe haven and sold off quite impulsively.
The recovery was gaining momentum but resistance emerged around $46k. However, the upside has not been damaged completely and things should remain favorable for bulls as long as the price continues to trade above the 4h chart 200 SMA and also the key support area highlighted on the chart, currently located at $40k-$41k.
If tensions will deescalate next week, we should expect to see the price continuing to move up. In that scenario, Bitcoin could push past $46k and potentially threaten to reach the $50k area for the first time since the end of December 2021.
On the other hand, deteriorating risk sentiment can push Bitcoin towards the above-mentioned key support area, increasing the risk for a further continuation lower. So far, war-related risks seem to be waning, but the beginning of next week will tell more on this matter.
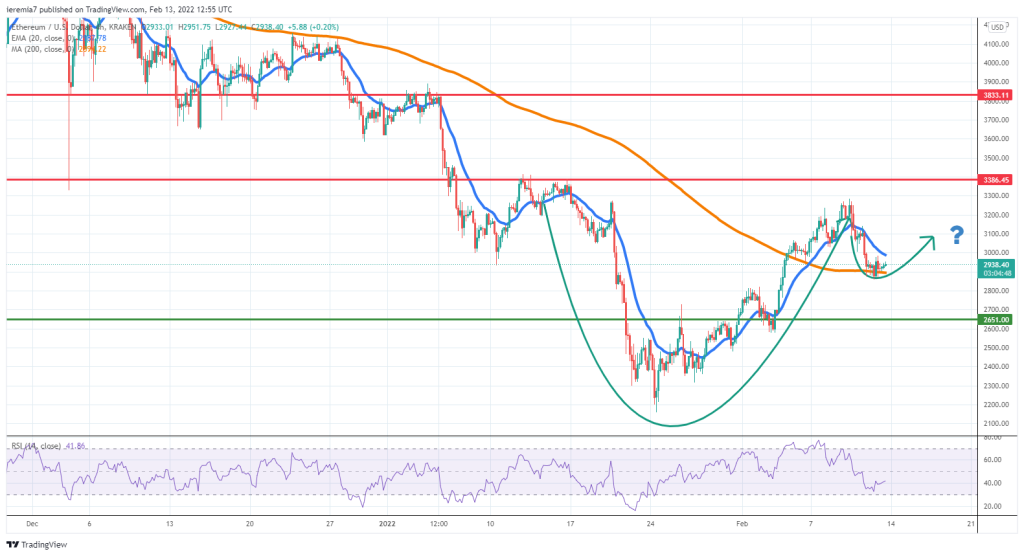
ETHUSD (Kraken)
Source: TradingView
Ether was also under pressure since February 10th, but so far the pressure is contained around the 4h chart 200 SMA. Let’s see if the market can stage a turnaround near that zone, but so far, risks to the downside are not escalating further.
The $2.9k area can turn out to be strong support and if it holds, we think Ether can move up, attempting a new breakout above $3.3k. A cup and handle pattern is on the cards so in case the script plays out, we suspect next week will end up bullish for the tokens.
A bearish scenario should not be ruled out and a breakout below the temporary bottom shaping up right now might send ETH towards $2.6k. Further selling will be an indication bids won’t be found until close to January 2022 lows. The focus is turning from inflation to war risks and traders need to see how different risk assets are being influenced.
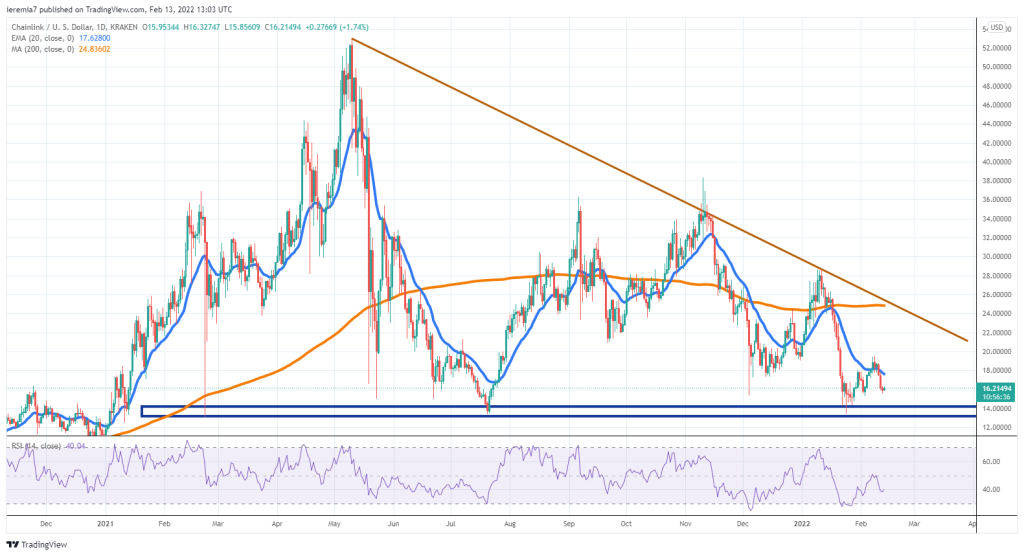
LINKUSD (Kraken)
Source: TradingView
Chainlink has been underperforming as of late but still, the price remains above a critical support area that held since the beginning of 2021. Each time the market reached that zone, the price bounced higher and the same happened at the end of January this year.
Because sellers did not drive the price below, that is encouraging short-term, but also one should consider the sluggish bullish momentum. We think LINK could edge up towards the $22-$24 area and how impulsive that would occur could determine the next path forward.
If choppiness will persist, that will be a sign of weakness and the price could continue to edge lower. The next level is $10, a psychological point that needs to be monitored in case the big support zone will fail. Longer-term, the price action structure is not encouraging for Chainlink right now, which is why there is a slightly higher probability bears will continue to be in control.


There are no comments at the moment, do you want to add one?
Write a comment