
BTCUSD (Coinbase)
Source: TradingView
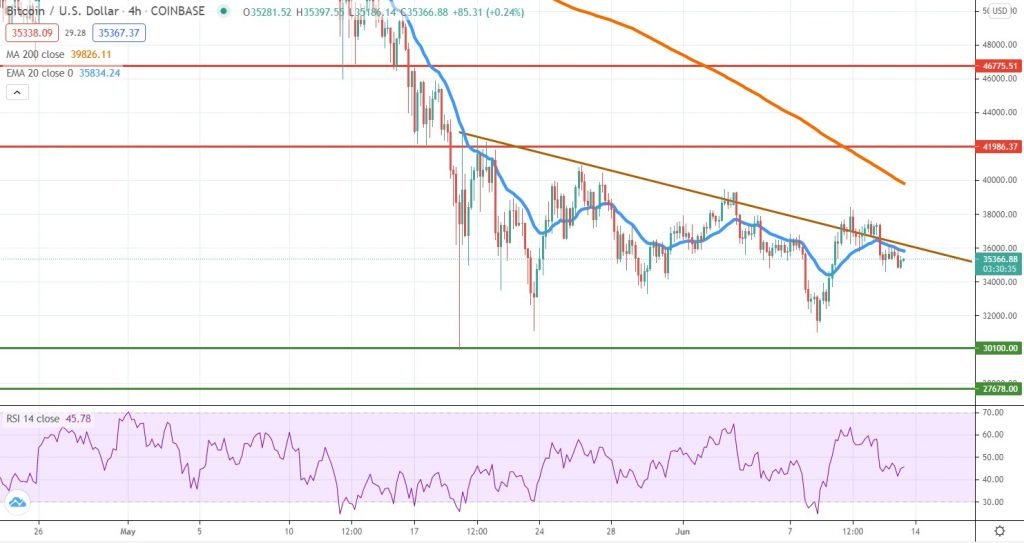
Bitcoin buyers will need to wait a little longer until the pullback on the upside will materialize. The triangle formation mentioned a week ago did not turn out to be a valid structure and now we see the string of lower highs keeping the pressure elevated.
Even though selling picked up momentum during the past week, it was contained around $32,000, showing buyers are willing to join on dips. Selling capitulation should not be excluded, which means there could be another leg lower until we see stronger buying momentum.
That will put the $30k – $27.5k area in the spotlight since that is where bulls are expected to react stronger. It is also possible to see BTC breaking above the descending trendline and push higher towards the $40k area, where the 4h chart 200 SMA is also located. The RSI is around 45 so any scenario is plausible right now.
A key downside is that the positive momentum in stocks does not facilitate strong Bitcoin buying, communicating the high correlation seen last year is no longer valid.
ETHUSD (Kraken)
Source: TradingView
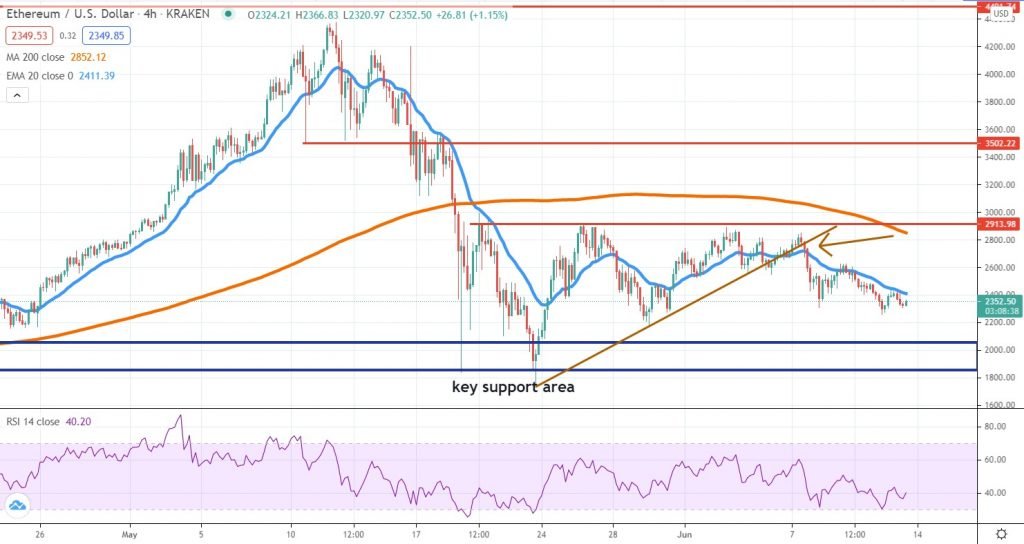
Ether broke below a short-term ascending trendline during the past week and that had been a bearish sign. The relationship with the 20 EMA changed and sellers were back in control, pushing the price towards the $2,200 area once again.
Although it is not a major bearish shift, it confirms the price is still locked inside a range and only an impulsive breakout could change that. If pressure will continue to mount, buyers should be looking after clues around the $2,000 area.
They will need to cap the downside in order to confirm the range is still in play and a new leg up towards $2,900 might unfold. We don’t know yet if we’re dealing with a bottoming structure or a consolidation after an impulsive move, which could imply more pain lies ahead for ETH.
LINKUSD (Kraken)
Source: TradingView
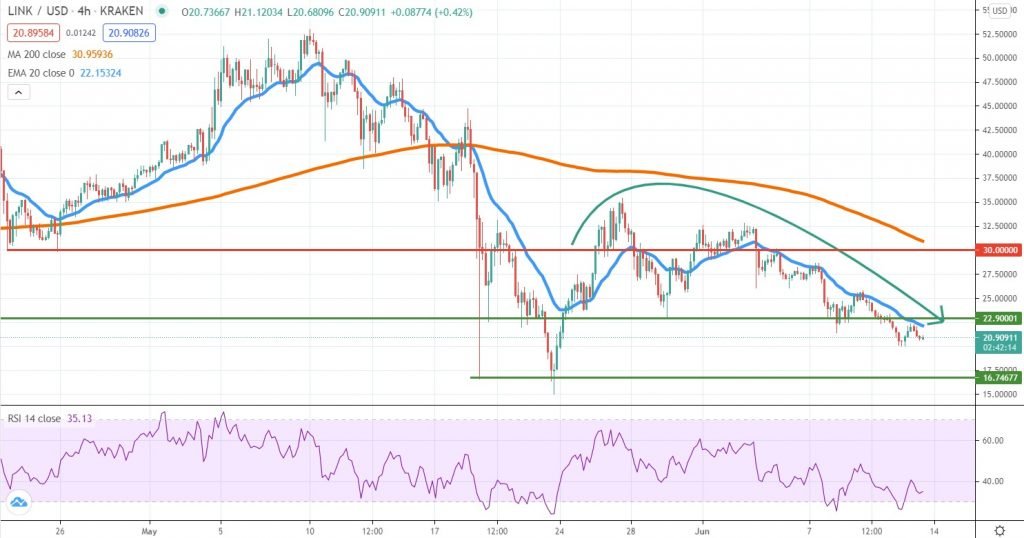
Even though the selling pressure is not as intense as it was in May, Chainlink continues to roll over parabolically, looking poised for a retest of the $16.7 support area. Last month’s selloff had been capped by that zone, which is why buyers will be taking a close look at it.
This is the largest DeFi token in the market, yet that does not seem to be a bullish driving factor. LINK reached an all-time high around $52 and since then lost more than 60% of its value, showing that any strong bull run is vulnerable.
Valuations are more attractive now as they were two months ago, but buyers will still need to wait for a change in the price action structure. An early positive sign of change will be if LINK breaks above the 4h chart 20 EMA and starts treating it as support, instead of resistance. In that case, we expect to see a rebound towards $30, which is where the 4h chart 200 SMA will also be located.


There are no comments at the moment, do you want to add one?
Write a comment