
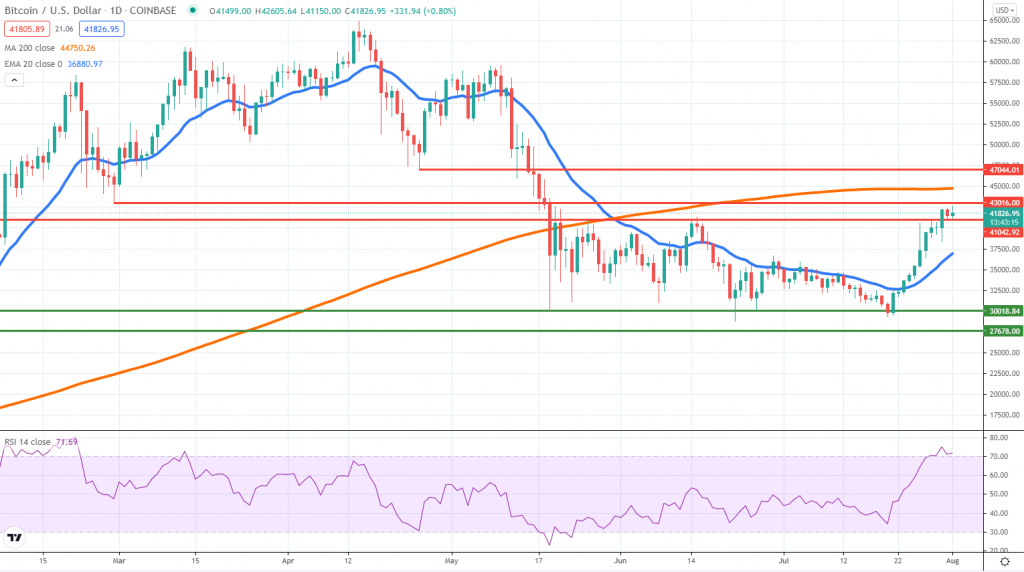
BTCUSD (Coinbase)
Source: TradingView
The Bitcoin recovery continued as the price managed to reach and even break above the $40,000 key resistance area, It also managed to overcome the high seen on June 15th and that is negating the short-term bearish bias we had in place. Looking ahead, it would be critical to watch if the price will break above the daily 200 SMA.
That will confirm the bull trend might be closer to a resumption, after months of underperformance. 11 out of the last 12 daily candles closed green, communicating how strong the buying momentum was. It is against probabilities to go against such an impulsive move, which is why our take is that Bitcoin can continue up, with $47,000 as the first major area of resistance ahead.
Despite our stronger bullish tone, that does not mean a corrective move lower can’t occur. Pullbacks towards the daily 20 EMA should be treated as buying opportunities, while a break lower is the only development that could put the move up on hold temporarily. The RSI is already in overbought territory, creating an environment where setbacks are likely.
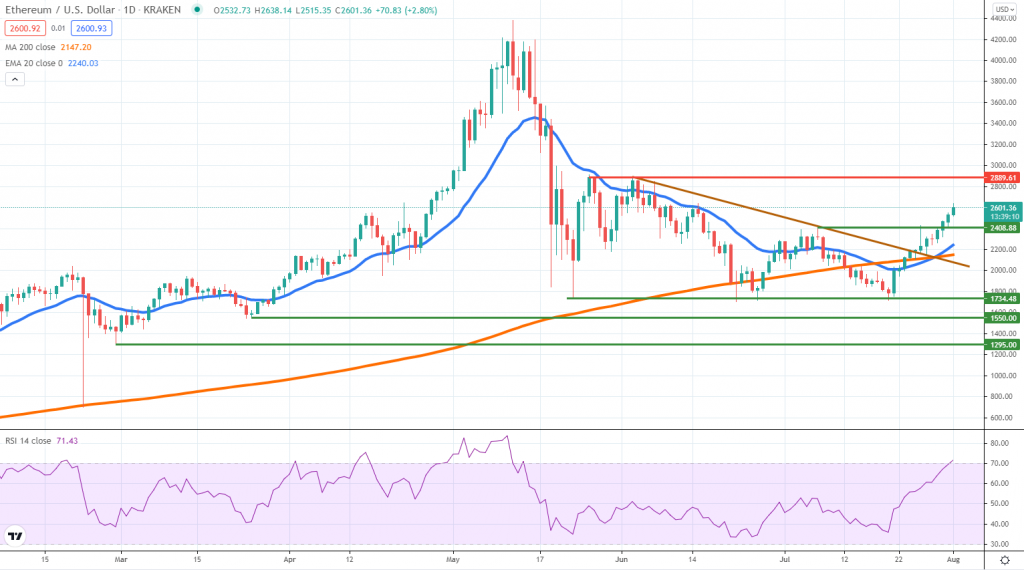
ETHUSD (Kraken)
Source: TradingView
Ether broke above the trend line highlighted in our last weekly crypto analysis and it was a strong sign of buying. The price is now trading above the daily 20 EMA and 200 SMA, communicating the momentum has shifted in favor of buyers.
Because of that, we expect ETH to continue higher as of August trading kicks in full force tomorrow. The first area of resistance to watch is located around $2.900. We see three major rejections there back in May and it could be a place where buyers take some profit or sellers jump in.
Same as with Bitcoin, pullbacks to the moving averages might be seen as buying opportunities, as this bull move has been very impulsive thus far. Buyers will be incentivized to step in if valuations get more attractive.
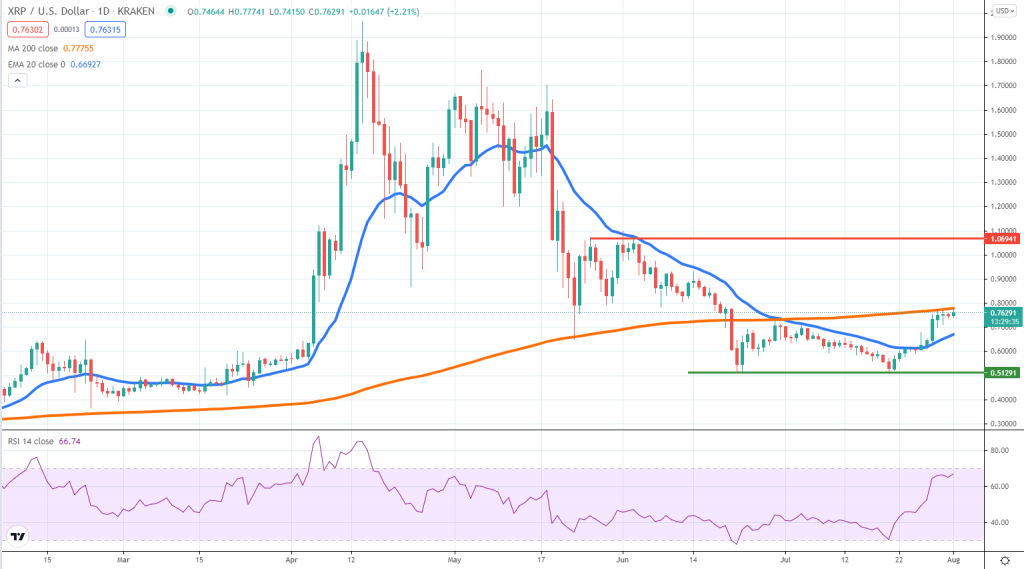
XRPUSD (Kraken)
Source: TradingView
XRP is among the best-performing cryptocurrencies for the week, up over 25%. The price is now trading close to the daily 200 SMA and that is supposed to be a dividing line between bullish and bearish territory.
A break on the upside will change the technical picture in favor of the bulls and create more incentives to push the price on the upside. We suspect there is potential for a continuation towards $1 or even $1.06, where a resistance area is located.
The buying momentum eased over the past couple of days and that should also leave a pullback on the table. The 70 cents area, where the daily 20 EMA is located is a good place for buying resumption.
In case of a breakout lower, the 50 cents area and the place where the bear market bottomed would be at risk once again. How XRP develops from this point forward will also depend on whether the broad market managed to sustain the gains and continue to recover losses.


There are no comments at the moment, do you want to add one?
Write a comment