
BTCUSD (Coinbase)
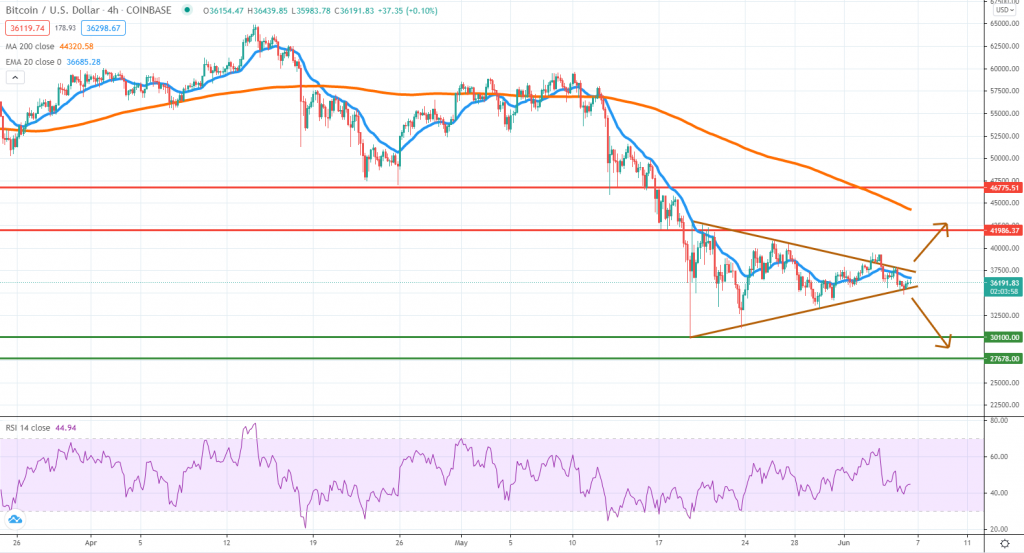
Source: TradingView
The symmetrical triangle formation we’ve talked about continues to be in play, as neither side of the market was able to generate a strong price action move. However, since the structure is almost full, we suspect a breakout and a burst of volatility is very likely to occur during the next week, ending the uncertainty on what will be the next Bitcoin direction.
Breaking on the downside will be short-term negative news and we suspect BTC will retest the $30,000 area once again. Below that, buyers should be looking at new clues around $25,000.
If the triangle will break on the upside, that could be the beginning of a relief rally, pushing Bitcoin back towards the $40,000 area. During May, the 4h chart 200 SMA was a strong resistance area, which is why the upside could be capped around $45,000.
After several weeks of negative performance, a pullback is what many buyers are expected to see right now. Elon Musk tweeting has shifted into a headwind for BTC, but other factors could outweigh that.
ETHUSD (Kraken)
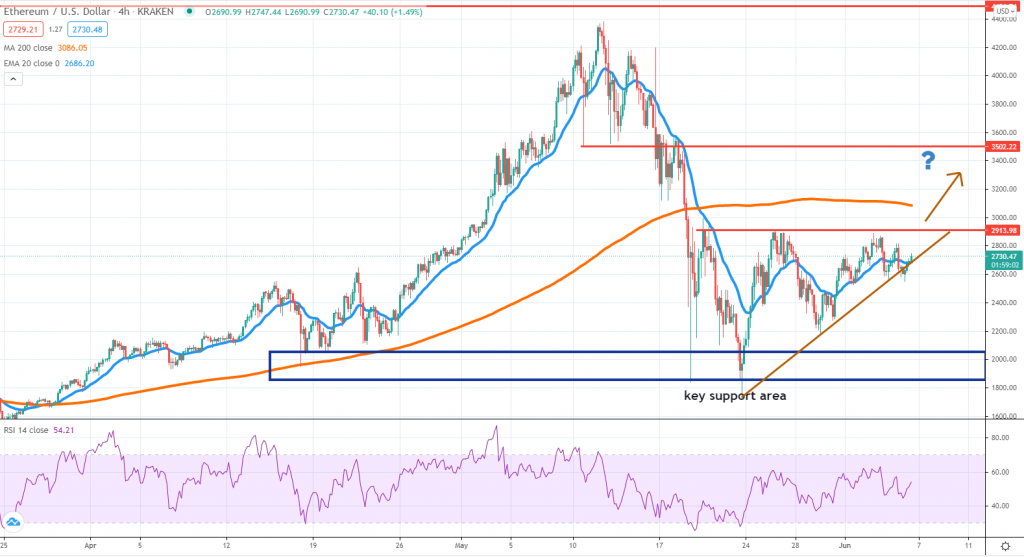
Source: TradingView
The ETH picture is looking more positive due to a series of higher lows and higher highs that occurred during the past week. Right now the price seems poised for a retest of the $2,900 key resistance area, which could further reinforce the fact this is a pre-breakout structure, with potential more positive outcomes for bulls down the road.
In case this bullish scenario will be the winning one, the next resistance area to overcome is around $3,100 – $3,200, where the 4h chart 200 SMA is also located. Buyers breaking above that will show a clear path towards $3,500, another interest zone on the chart.
On the other hand, a breakout below the short-term ascending trend line will be bad news for buyers since that could pressure Ether back towards the $2,000 area. The broad market sentiment will also have a major impact on how ETH performs next week.
LTCUSD (Coinbase)
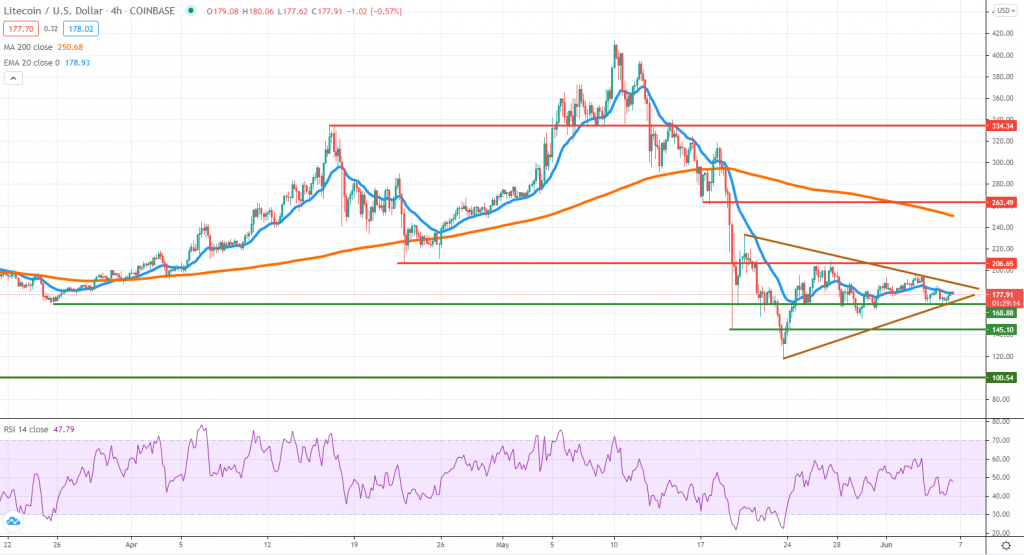
Source: TradingView
Litecoin is among the tokens that were hard hit by the May selloff, dropping from $400 to around $120 in 12 days. Losses were massive and as expected, a short-term rebound occurred, yet we see buyers struggling to keep the gains.
This is a cryptocurrency closely correlated with Bitcoin and that’s probably why we see the same symmetrical triangle again on the 4h chart. If the sentiment improves over the next few days, LTC could start a new leg higher that will extend towards the $240 key resistance area.
Prices starting to roll over again would mean the $120 area might be revisited again before we see buyers resume in full force. The key $100 area is a psychological zone to watch, in case the May lows are breached.
Same as with Bitcoin, how the triangle will be broken can determine accurately where is Litecoin headed. There is a slight bias towards the buy-side given the oversold conditions, but until the breakout occurs, all options are on the table.


There are no comments at the moment, do you want to add one?
Write a comment