
BTCUSD (Coinbase)
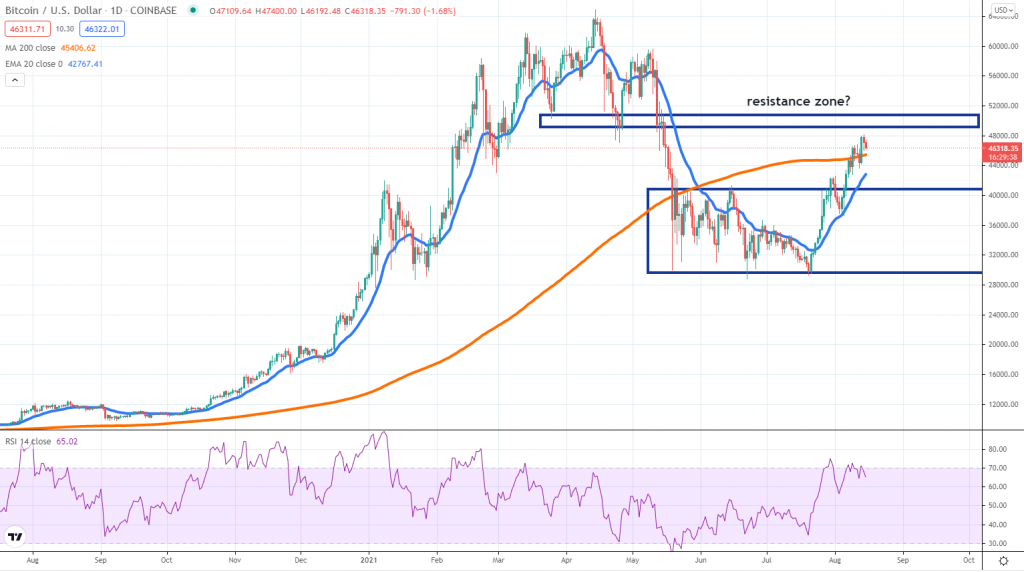
Source: TradingView
Although Bitcoin buyers were able to push the price towards new highs, the gains are not impressive, suggesting the bullish sentiment is weakening. BTC is now above the $40k area by a large, yet sellers are more active around the daily 200 SMA, which is thus far preventing an impulsive continuation higher.
We suspect a key area of resistance is located around $50k – $51k and only if buyers can break and hold above it, should we increase our targets near the current all-time highs. Markets participants wanting to gain long-term exposure to Bitcoin should remain patient and see how that area will end up influencing the price action developments.
If weakness starts to emerge, look at the daily 20 EMA and then the $41k area, which is now a role reversal zone, or a potential place where buyers could be incentivized to buy. The daily RSI is trading near overbought conditions and that is also putting a cap on the potential upside for Bitcoin during the next week.
ETHUSD (Kraken)
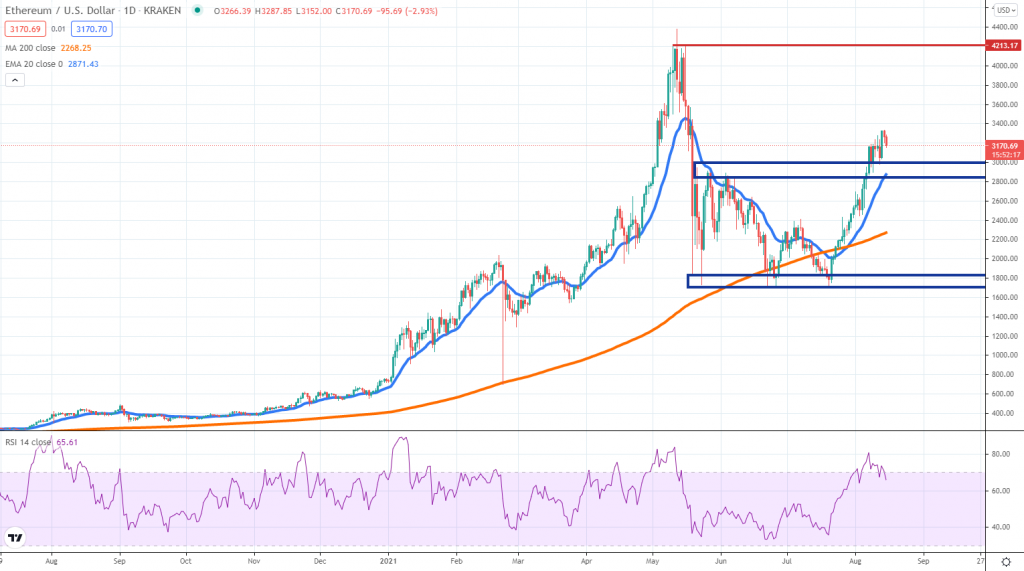
Source: TradingView
The same weakening bullish momentum can be spotted in Ether as well. The bulls are still in control, yet covered less ground during the past week. On the daily chart, the price did not reach the 20 EMA since July 24th, which makes us believe a correction towards it becomes increasingly likely.
In case that happens, it would be critical to watch whether the $3k – $2.8k area will manage to hold as support. If not, a deeper corrective move lower could extend towards the daily 200 SMA. Bulls had been enthusiastic about the recovery of price, but since it went up in a straight line without any pullbacks, there is potential downside weakness.
On the upside, the next major resistance is around $4,000 but that will require a lot more bullish strength. We believe there is scope for a deeper correction lower, given the market has been moving up in a straight line. The order flow was heavily biased towards the buyers but that is already waning.
LINKUSD (Kraken)
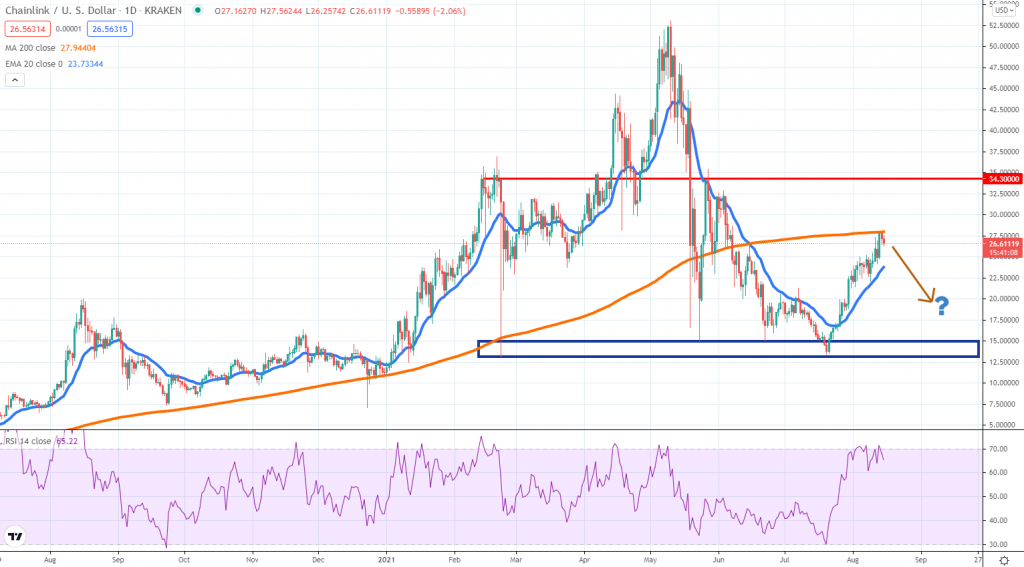
Source: TradingView
Chainlink staged an impressive recovery, in line with what happened in the broader market. The price jumped from $12.5 all the way to $27.5, more than 100% in gains since July 21st. However, the bullish move seems to be encountering resistance near the daily 200 SMA and that could be an early indication for a corrective phase.
That could push LINK towards the 20 EMA at first, with more potential downside ahead if selling persists. A breakout above the 200 SMA will be an important bullish development and will create more upside room towards $34.
The bearish scenario implies buyers won’t be able to sustain the gains seen during the past 3 weeks and the price will weaken again towards the $12 area. A break below would be a sign the bear market will extend even further before buyers step in more aggressively.


There are no comments at the moment, do you want to add one?
Write a comment