
BTCUSD (Coinbase)
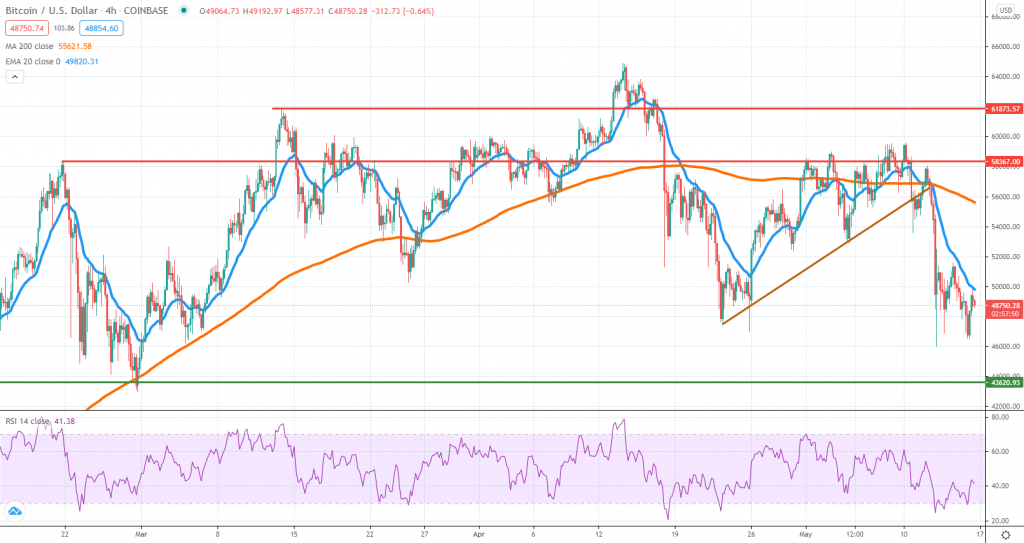
Source: TradingView
A week ago we’ve warned that a breakout below a short-term ascending trend line could generate an impulsive selloff and as it can be easily noticed from our chat, the price dipped towards $46,000 before finding some buyers. However, the price action context continues to be favorable for sellers and now we suspect BTC could continue to weaken, until the $43,000 support area.
What happens there will be key to determining whether the sellers will continue to be in control and push valuations lower, or if a more sustained bounce will start to unfold. Although the sentiment had deteriorated since Tesla announced it won’t longer accept BTC as payment for their products, it might be possible to see a turn to the upside in the following days, in case other risk asset classes will perform well.
The price needs to break above the 4h chart 20 EMA and only if that will be the case, should we expect a short-term recovery. If not, the sellers will continue to hold the upper hand and more pain might come down the road.
ETHUSD (Kraken)
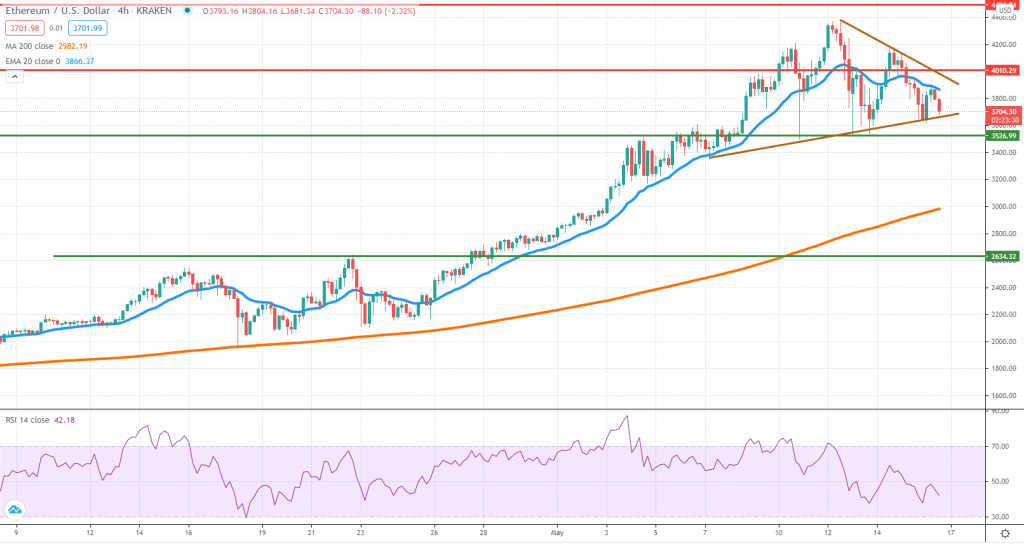
Source: TradingView
Although Ether had managed to break above $4,000 and reached an all-time high around $4,400, buyers were unable to sustain the gains and now the price is trading near the $3,700 mark. On top of that, we can notice a triangle formation and heavy selling as the price approaches the lower line, a warning sign suggesting bears might drive the price even lower.
If there won’t be solid support around $3,500, then buyers should brace for an extension lower towards $3,000, where the 4h chart 200 SMA is also located. The RSI continues to point south and that is not helping to improve the sentiment at all.
For now, it would be important to stay on hold and monitor the price action performance around the lower bound of the triangle. False breaks below followed by stronger bids shouldn’t be excluded, as triangles are very unstable price action structures.
XRPUSD (Bitfinex)
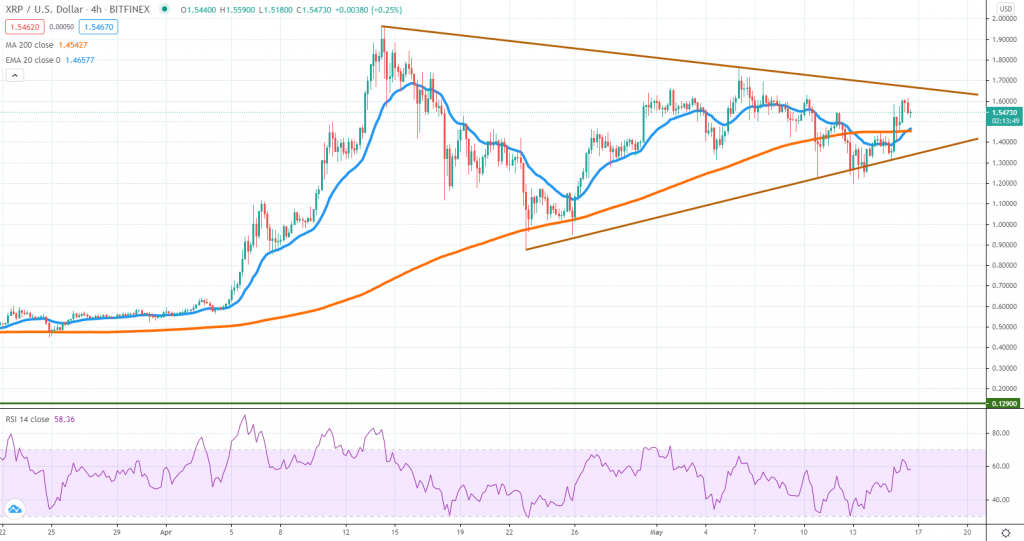
Source: TradingView
XRP volatility continues to compress and that should make market participants more engaged since the natural reaction is generally an impulsive move. The price is trading inside a triangle and as the formation is almost filled, the question is whether buyers or sellers will prevail.
For the time being, we see buyers in control and optimistic performance during the past few days, as XRP seems to have outperformed both Bitcoin and Ether. The next thing that needs to happen for more buying momentum to start unfolding is a breakout above the triangle, as well as follow-through buying. $2 will be the key resistance area to watch if that will be the case.
The opposite scenario should see XRP weakening towards the $1.4 area and break below the triangle. In that case, the price could weaken towards $1, where buyers started to push higher during the end of April.


There are no comments at the moment, do you want to add one?
Write a comment