
BTCUSD (Coinbase)
Source: TradingView
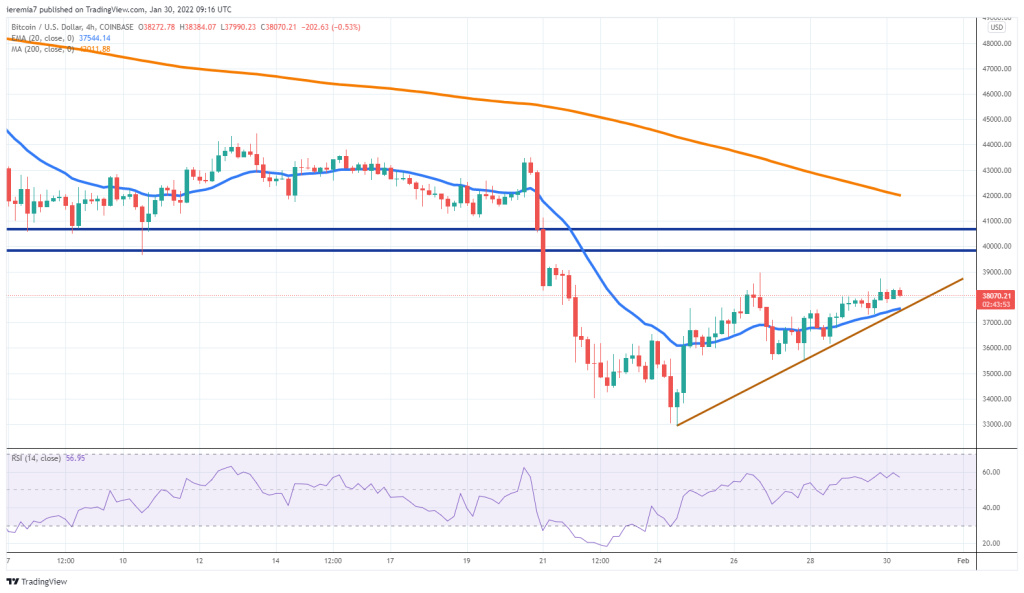
The Bitcoin sentiment did not continue to deteriorate over the past week, even though the price action has been choppy. We see a short-term recovery building around an ascending trend line, but still, more positive developments should follow if buyers want to reverse course.
For the time being, market participants need to monitor how Bitcoin will perform around the $40k – $41k area. That is a role reversal level and if breached on the upside, could spur new bids. The 200 SMA on the 4h chart also moves towards $42k, which is another area to watch for selling interest.
An initial sign of weakness will be if the price breaks below the trend line and continues to head lower. In that case, the current January low around $33k will be under pressure once again. We still believe BTC is headed towards the $30k key support area, because that is where strong buying can emerge, enough to generate a robust reaction from the bulls.
ETHUSD (Kraken)
Source: TradingView
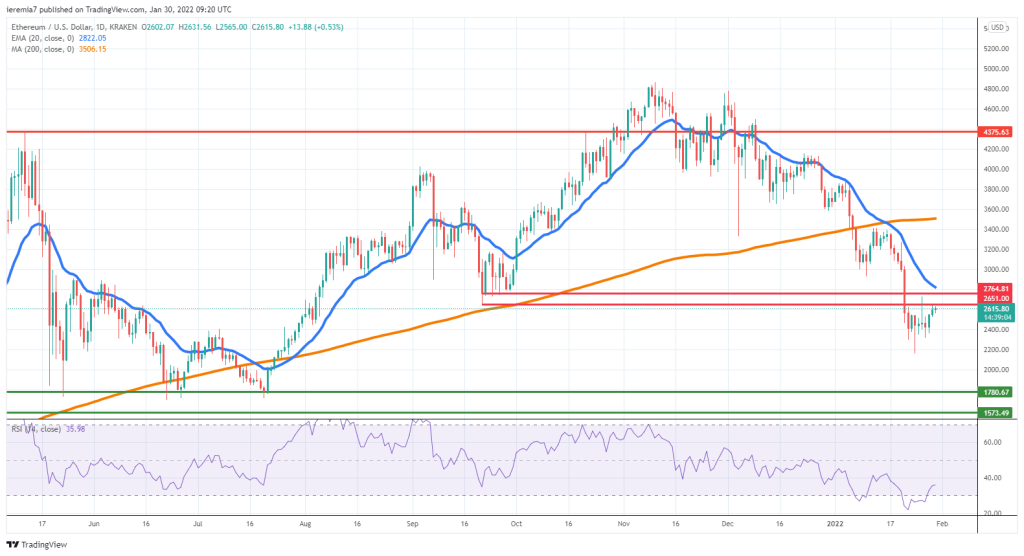
Similar to what Bitcoin did, Ether also managed to recover some of the lost ground, but the price action remains below a key resistance area. We think there is scope for some more gains, as month-end rebalancing can play a role in driving the order flow.
However, the daily 20 EMA has been treated as resistance since December 2021, which is why it’s too early to call for a major bottom and an impulsive surge higher. The RSI also recovered from very oversold conditions, but now that the market took its breath, renewed selling must not be ruled out.
The $2.2k low is the support area to watch now, as if it holds, the price can continue to rotate higher. A break below it will exposure $2k and even the $1.8k area we’ve talked about in the past. Recent bullish developments pale in comparison to the prior selloff, which is why we remain reluctant with regards to the potential for a bull run.
XRPUSD (Kraken)
Source: TradingView
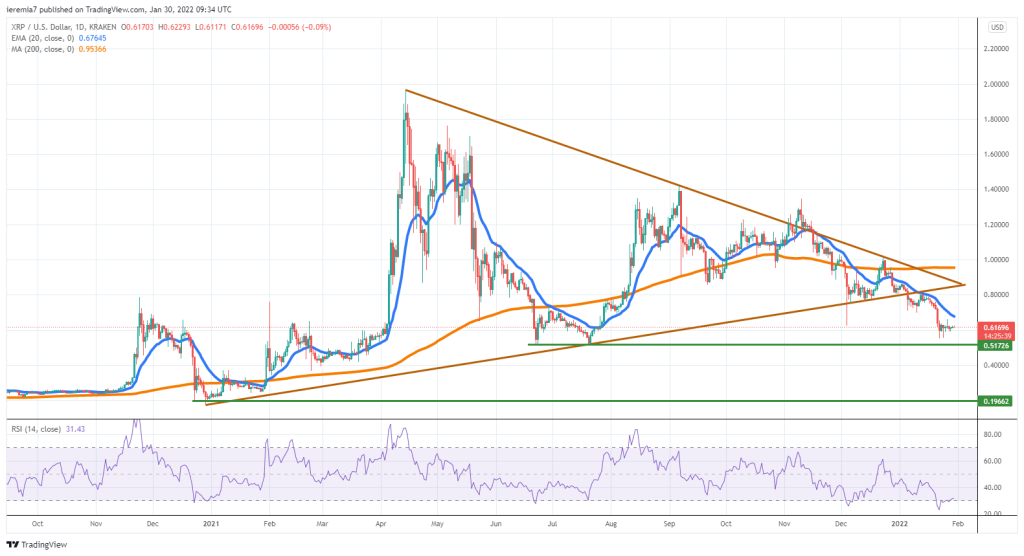
When looking at XRP, the bounce is weaker, which leaves the price vulnerable in the face of further selling. We are now below the major triangle pattern formation and that should be the reason why buyers are keen to buy XRP.
In that case, there is scope for continued weakness, which could push the price towards the 50 cents area, where we can see two bounces, in June and July last year, respectively. Continuation below will be a major warning sign, given XRP can weaken towards 20 cents after that.
On the flip side, if the price breaks above the daily 20 EMA, we could see the bottom line of the triangle retested. In that case, XRP could stage a 30% rally, something many buyers have been expecting for a long time.
The big picture suggests that investors and traders are not paying increased attention to XRP. Until the price action will show signs of improvements, like breaking above the daily 200 SMA, activity should be subdued.


There are no comments at the moment, do you want to add one?
Write a comment