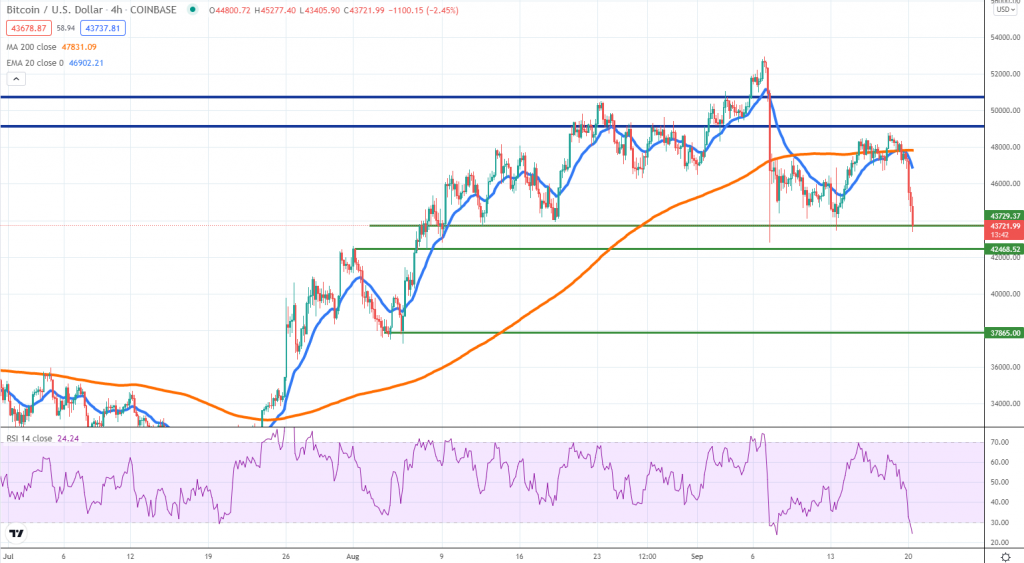
BTCUSD (Coinbase)

Source: TradingView
As we’ve anticipated a week ago, Bitcoin bounced from the lows but failed to keep the gains. This week starts with massive selling across the board, as financial markets are digesting a potential default of Evergrande, one of the largest Chinese real estate developers.
From a technical standpoint, the support is located between $43.7 and $42.4. A clear break below that area will be bad news for Bitcoin bulls since it could be an early sign for a continuation towards the $38k area.
The current selling pattern is parabolic and turns out to be a topping formation, putting the bullish sentiment on hold. Given sellers show no sign of weakness, we remain bearish on Bitcoin until there will be signs of relief.
Buyers should look at key support levels and wait to see if there is demand around them. With Chinese markets closed due to holidays, investors might have to wait until Wednesday for more clarification. That is when the Fed meeting will take place, and crypto traders should watch for USD implications to anticipate moves in BTC as well.
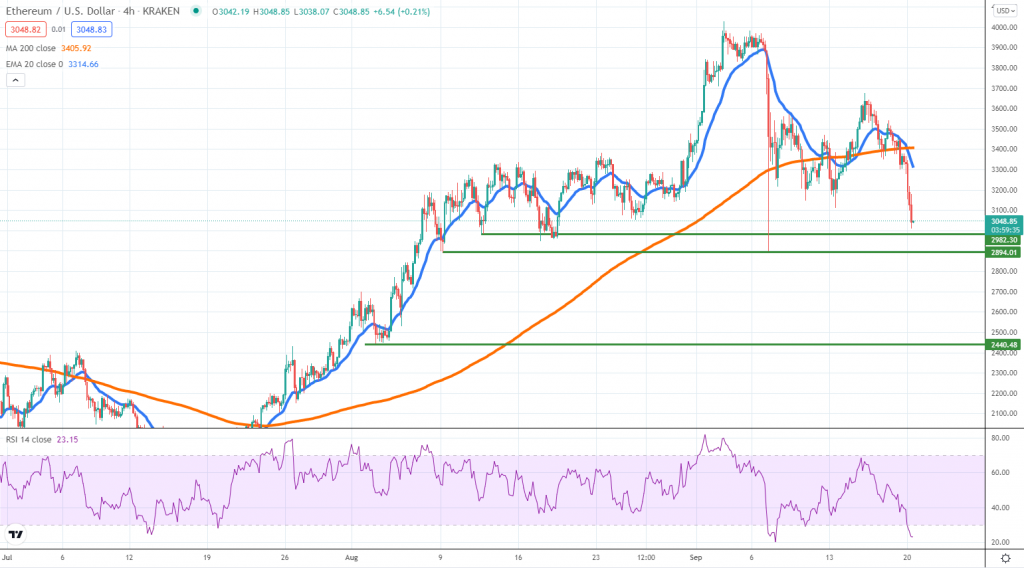
ETHUSD (Kraken)

Source: TradingView
In the same fashion as Bitcoin, ETH is now seen under heavy pressure. The price broke below the 4h chart 200 SMA and now looks poised for a retest of the key support area located around $3k and $2.9k.
How the price reacts to it might define the trend for the next several days. Below it, we suspect further weakness towards $2.4k might follow. Due to oversold conditions visible on the RSI, it is possible that a short-term bounce could ease some of the pressure.
Traders should look at lower time frames to see how the 20 EMA and 200 SMA are reacting for further clues on whether sellers are aiming to get back in at higher prices.
At this point, only a breakout above $3.5k could revive bullish expectations but that area looks very far. However, the sentiment can twist on the upside pretty fast and traders should be prepared for a recovery in the second half of the week.
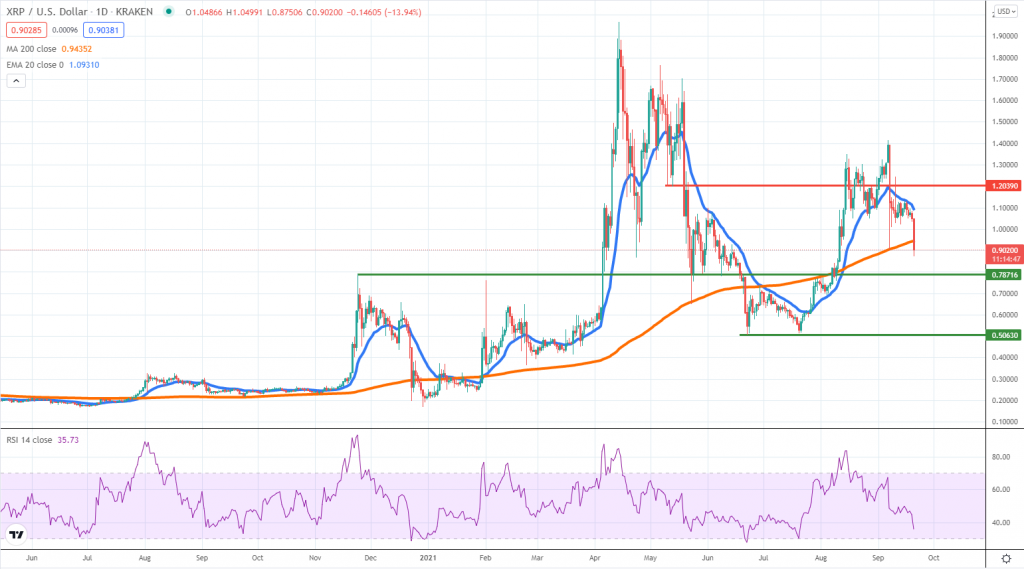
XRPUSD (Kraken)

Source: TradingView
XRP is another token at a crossroads, considering the price is now testing again the daily 200 SMA. A breakout below that line would be a major sign of weakness, with more selling to follow towards 78 cents or 50 cents in the longer run.
Given the impulsiveness of the move, we don’t rule out a breach lower, followed by choppier developments. Long-term buyers should wait and see for more clues, especially how global stock markets perform.
Thus far, there has been a strong correlation between stocks and cryptocurrencies, as the fear spread across all asset classes.
Short-term bounces are expected to find a cap near the daily 20 EMA and only a strong break above it could revive buyers. The next significant hurdle to overcome would be $1.2 that right now that’s the least likely scenario.


There are no comments at the moment, do you want to add one?
Write a comment