
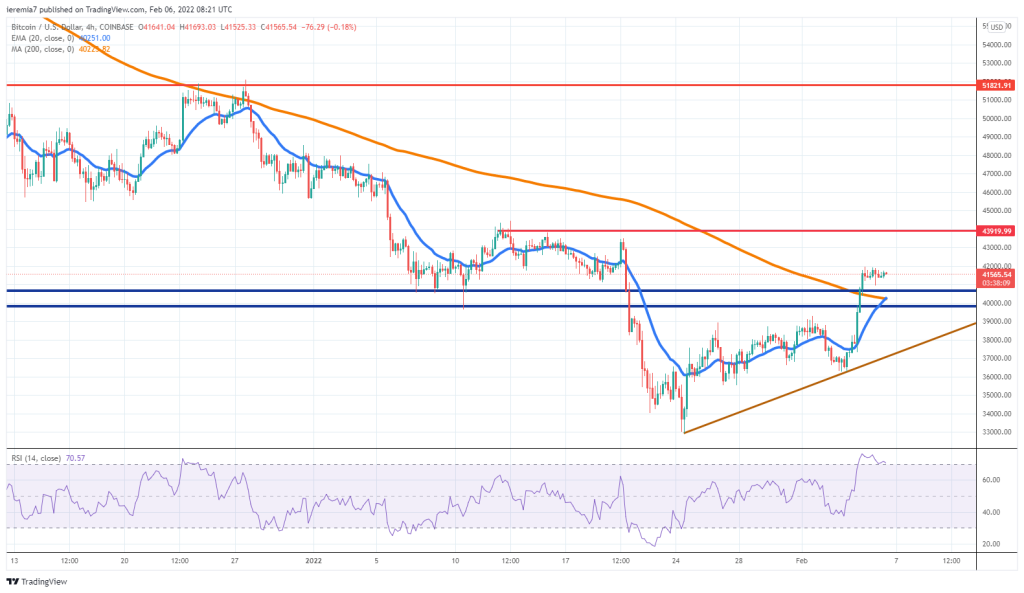
BTCUSD (Coinbase)
Source: TradingView
After weeks of underperformance, Bitcoin finally managed to stage a more robust rally, breaking above the 4h chart 200 SMA and also a key area we’ve highlighted over the past several weeks. Activity remains subdued for now so we’ll have to wait and see how market participants will drive the price action once next week starts.
This short-term rally is encouraging as it shows there are still people interested to buy after a strong dip. Follow-through buying can push the price towards the $44k resistance area, where we can see some spikes back in the first half of January. Breaking higher will mean there will be an increased probability for a retest of $52k, another important resistance to watch.
Overall, if the market treats the 20 EMA as support, that’s an indication the bullish sentiment will persist. For an extended period, the blue line was treated as resistance, and now that the price trades above it, we should stick with a short-term bullish view.
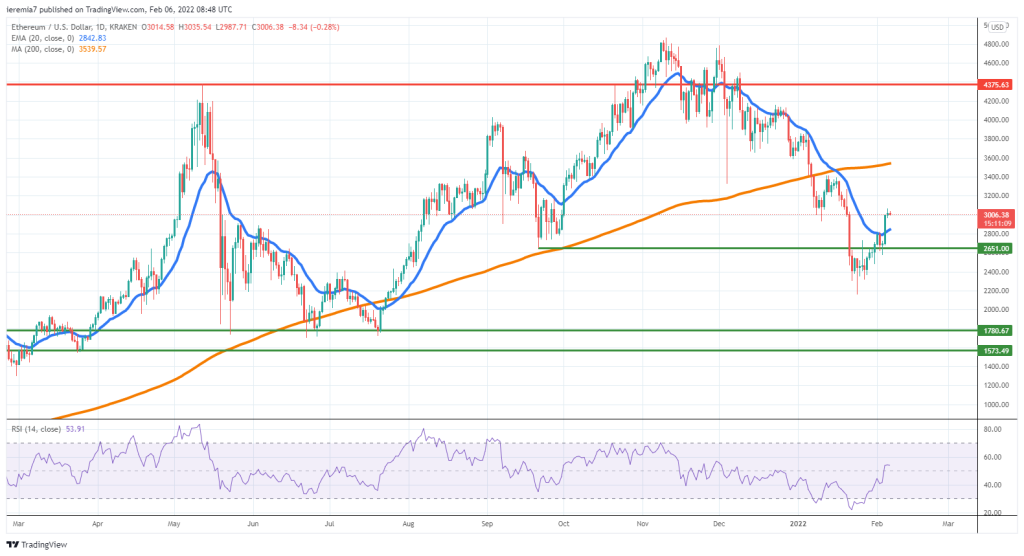
ETHUSD (Kraken)
Source: TradingView
Similar to what we are seeing in Bitcoin, Ether is also rebounding strongly from the lows, breaking above the daily 20 EMA. The beginning of next week will be critical in determining whether the leg up can extend further.
We should not see impulsive selling resuming if buyers still hold control. Instead, at worse the price can mildly correct towards the EMA and then continue up. In this case, we believe there is scope for further gains towards the $3.6k critical resistance area.
On the other hand, if there will be renewed selling and the price breaks back below the 20 EMA impulsively, that will be a sign of weakness and $2.6k could be revisited. We now have a V-shaped bottoming and there should be at least a leg lower before buying get confident and drive prices higher. Ether is not out of the woods yet, which is why we strongly urge caution. The USD has been weak and that has been a supportive factor for the crypto market.
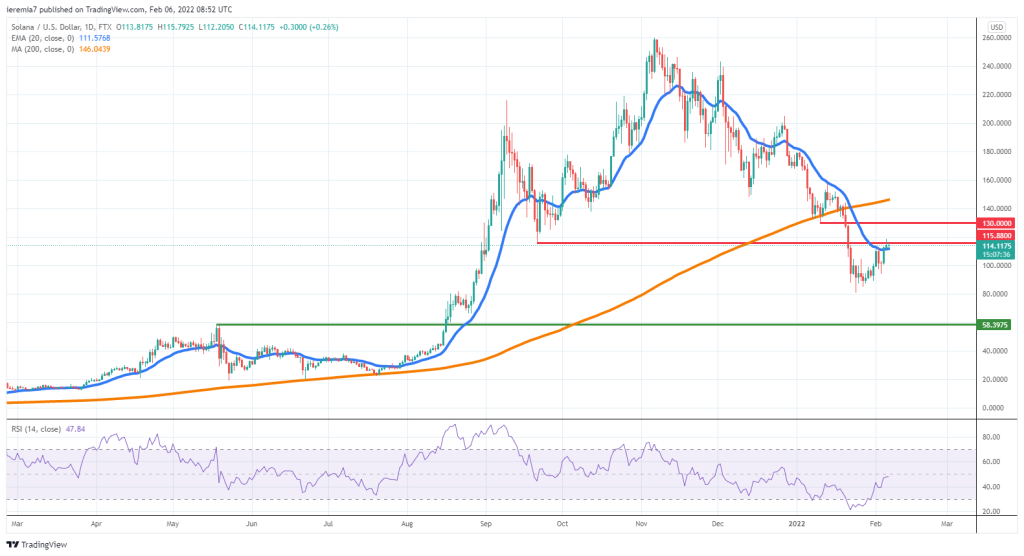
SOLUSD (FTX)
Source: TradingView
Solana is another top performer for the week, but as the charts show, buyers are now encountering resistance around $116, a low from September 2021. The selloff has been impulsive, erasing more than 60% of market capitalization, which is why the current rebound can be just a dead cat bounce.
Same as with the other two major cryptocurrencies discussed today, we need to see more buying next week, because only that will be a strong confirmation for renewed interest in crypto assets. In the case of SOL, failure to break above the first resistance is a caution sign which is why we recommend staying put for now.
Continuation on the upside will open more room towards $130 and then $150, where the daily 200 SMA is located. Conversely, selling pressure resuming can push SOL lower, towards $60, where a major support area is located. The bigger picture has not improved substantially yet.


There are no comments at the moment, do you want to add one?
Write a comment