
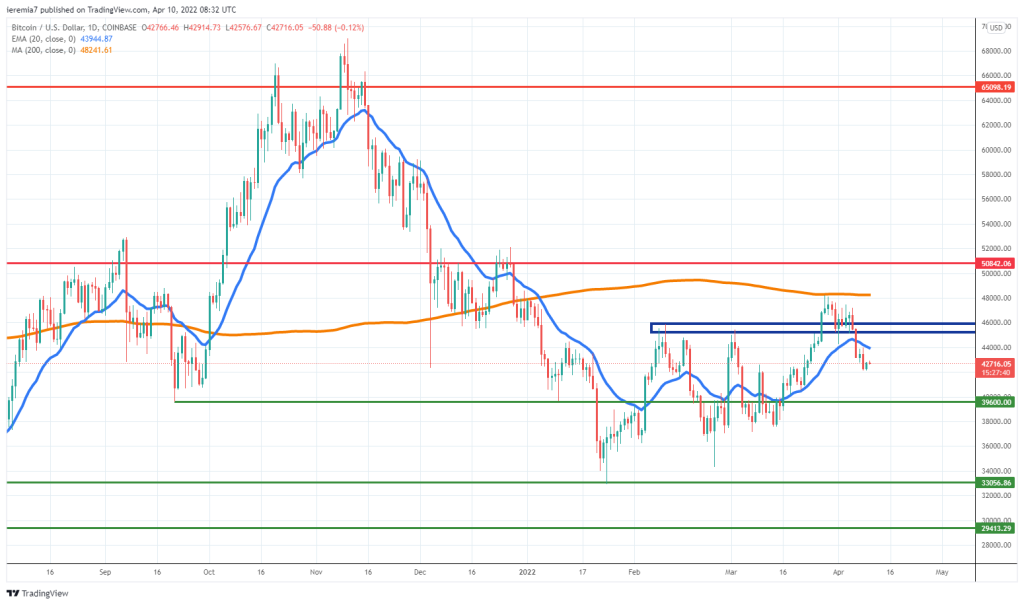
BTCUSD (Coinbase)
Source: TradingView
Despite the positive developments we talked about last week, Bitcoin took a turn for the worse and broke below a key support area, highlighted in blue on our chart above. At the same time, the price breached the 20 EMA and there are few price action hints suggesting buyers might be accumulating.
Sellers are in control over the order flow and we could see further weakness towards the $40k area during the next week. An acceleration of the move lower can put renewed pressure on $33k and even $30k. That is where the selling stalled, so a retest raises the prospects for a continuation below.
Bitcoin continues to trade below the daily 200 SMA (orange line) and the fact sellers treated it as resistance is another worrying sign to consider. For now, the sentiment is bearish, but a breakout above $48k could revive some buying interest. The consolidation phase that started at the end of January is still in play, even though buying has been rather weak, and selling on rallies was seen multiple times since then.
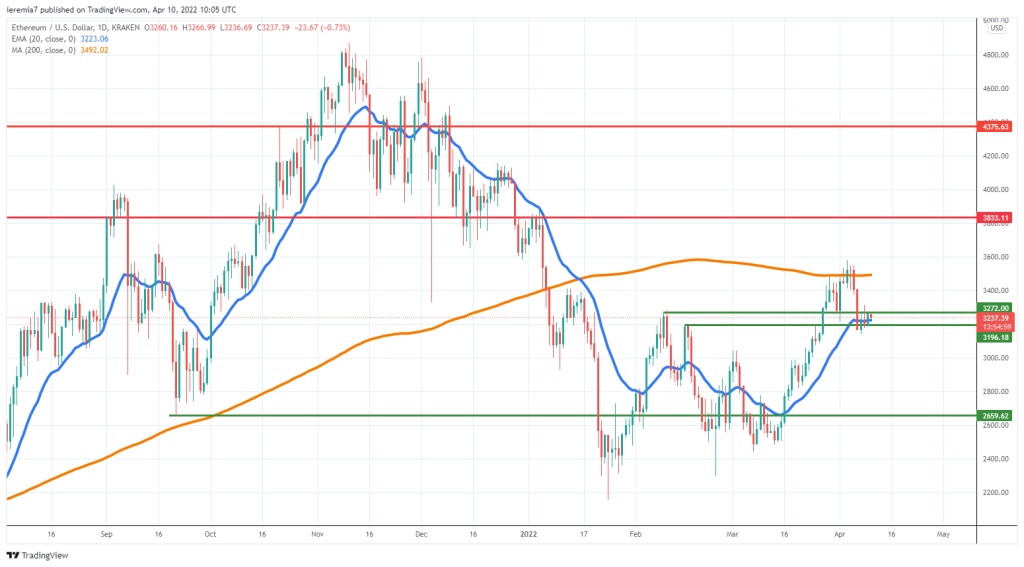
ETHUSD (Kraken)
Source: TradingView
In a similar fashion, Ether sold off after reaching the daily 200 SMA, an early sign of warning, considering the price has outperformed Bitcoin recently. There is broad-based selling and none of the major tokens are being spared.
We can see the selling stalled around the 20 EMA and also an area formed by two prior short-term highs now acting as support. Still, the bullish reaction is muted compared to the impulsive selling off the moving average, suggesting the order flow might be shifting in favor of bears.
Below the current level, sellers could push ETH towards the $3k psychological area, while if that won’t be enough to cap the downside, $2.7k will be next in line. Over the past week, selling in tech stocks has resumed and crypto has been positively correlated.
Further tech selling next week could mean Ether will be under selling pressure. As long as the price trades below the 200 SMA, conditions continue to favor the downside. Only a break above the current April high should revive bullish sentiment.
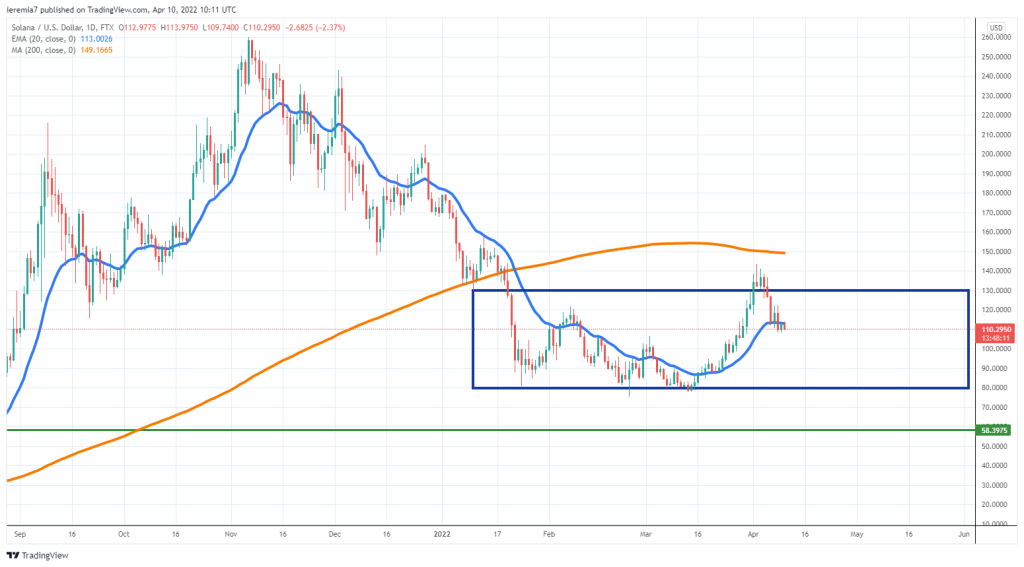
SOLUSD (FTX)
Source: TradingView
The last time we covered Solana, $130 was mentioned as a resistance level. As the chart is showing, that turned out to be a point where sellers got active again. The price is down over 20% last week and that sets up a negative sentiment for the next one.
As a result, if SOL continues to edge lower $100 and then $80 will follow as support areas. The lather is where the bottom for 2022 has formed and a break below would be a major blow for bulls. SOL can move lower towards $50 if that scenario materializes.
Above the current highs, $150 is where the daily 200 SMA can be found. Buyers could encounter strong resistance there. A rebound seems like the less-likely scenario right now, until we will start to see strong bullish candles on the daily chart.


There are no comments at the moment, do you want to add one?
Write a comment