
BTCUSD (Coinbase)
Source: TradingView
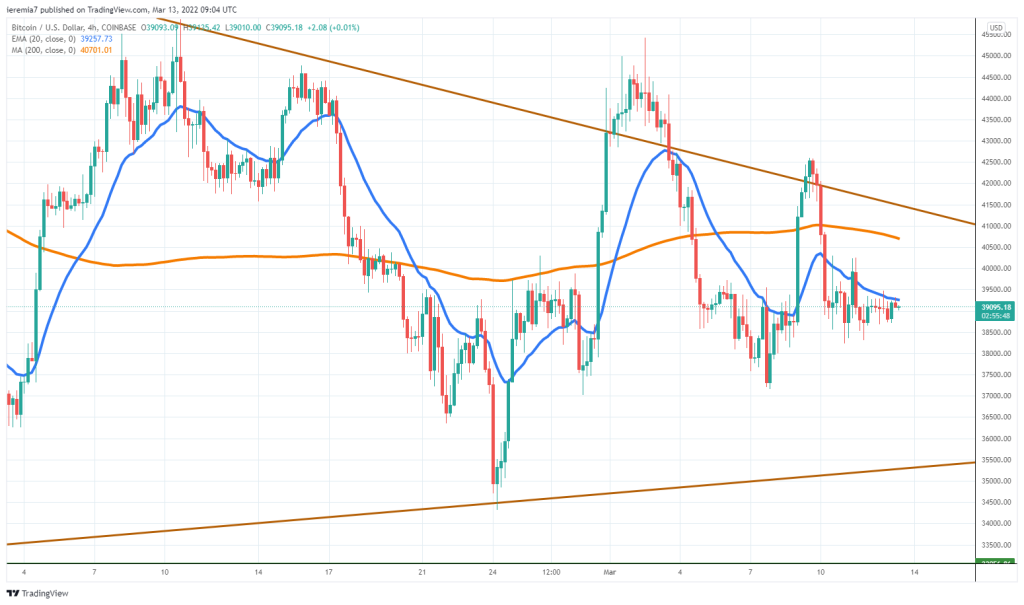
It has been another week of twists and turns for Bitcoin, making it challenging for market participants to find optimal entry locations. The price surged during the first few days of the week after details of a US executive order related to crypto have been released. However, sellers resumed impulsively and Bitcoin could not get past $42.5k.
The following days should remain challenging as the uncertainty around the Ukraine war is being doubled by the FOMC meeting. The FED is expected to raise rates and although the market is already pricing in 25 basis points, the key will be in the forecasts for the next few months, as well as the press conference.
With that in mind, we suspect Bitcoin will continue to fluctuate in a narrow range by mid-week unless there are major developments in the war. A surge above the 4h chart 20 EMA could open more room towards the 200 SMA and the descending trendline.
A breach below $37k would be a negative warning and in that case, we expect continuous weakness towards the $35k area. The overall sentiment remains bearish, so buying at this point could be tricky.
ETHUSD (Kraken)
Source: TradingView
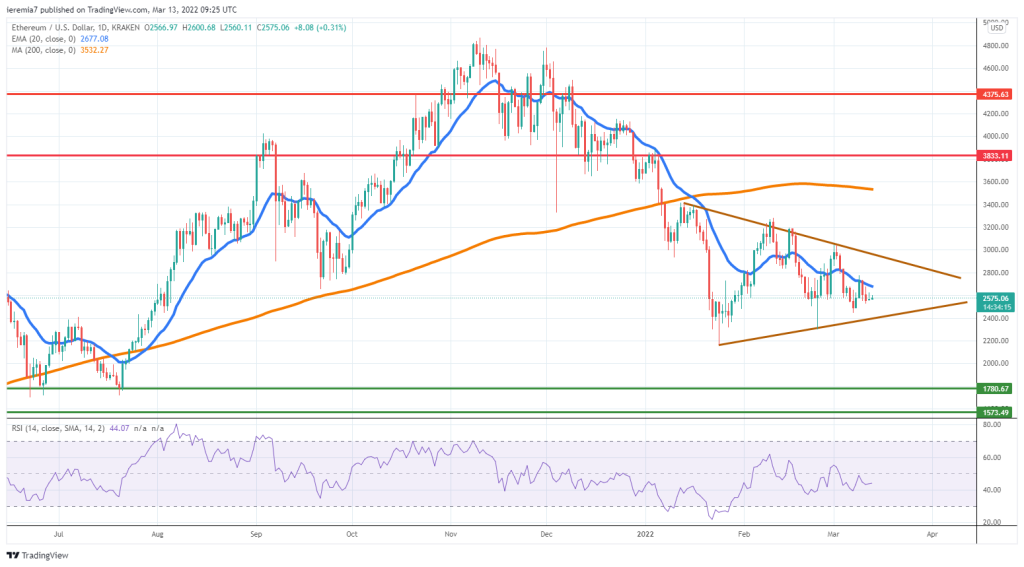
Similar to what the Bitcoin price action is showing, there doesn’t seem to be strong interest to buy Ether. The price was unable to break above the daily 20 EMA and now looks poised to retest the lower line of the triangle discussed last week.
Looking at the RSI, there is indecision in the market, so traders should stay put and wait for further clues. We want to see how the price reacts once it reaches the bottom of the triangle. If buyers emerge, a short-term bounce is on the cards.
In case a breakout will occur, that will mean ETH could weaken further, and $1.8k is the first major support area to watch. We maintain our bearish view until the price manages to break and hold above $3k.
SOLUSD (FTX)
Source: TradingView
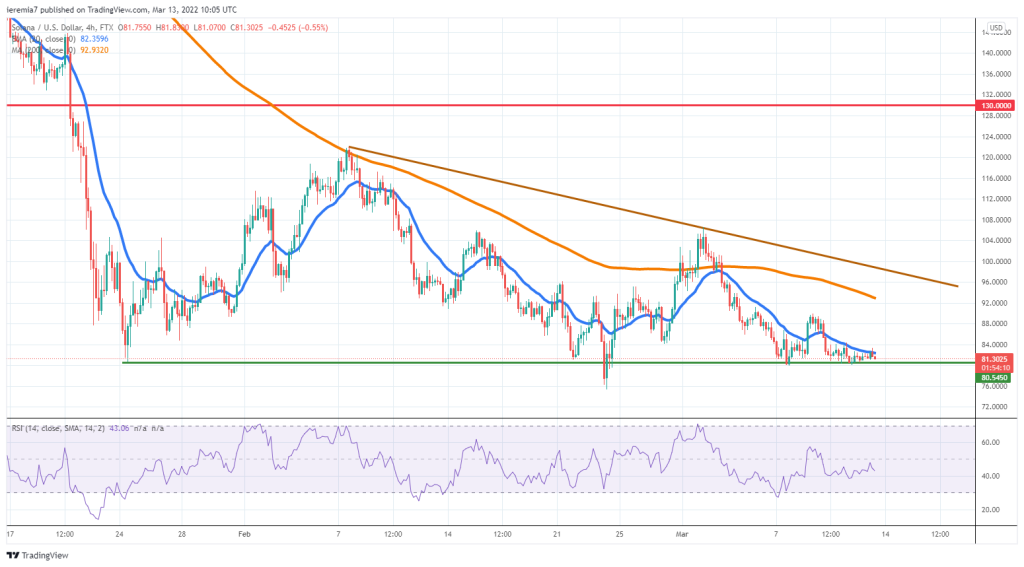
Solana is down approximately 8% over the past 7 days, but what’s even more important than that deals with the price action developments. We see it now close to the $80 key support area and a breakout below it will put pressure on the February 24th low.
Things are not looking good and there is a possibility for further weakness, which could drive the token towards $70 or even $60. This has been one of the top-performing cryptocurrencies and now that buyers are rushing for the exit, combined with the short-sell interest, we see a sharp reversal to the mean.
Still, a temporary bounce should not be excluded, as the price rose from the current level in the past twice. If that will be the case, look for sellers around the 200 SMA on the 4h chart, or the descending trendline highlighted above.
Only if SOL breaks above $105 should we expect a larger move up the upside. At this point, we remain skeptical about that happening, since more pain ahead could push the cryptocurrency towards levels not seen since last year.


There are no comments at the moment, do you want to add one?
Write a comment