
BTCUSD (Bitstamp)
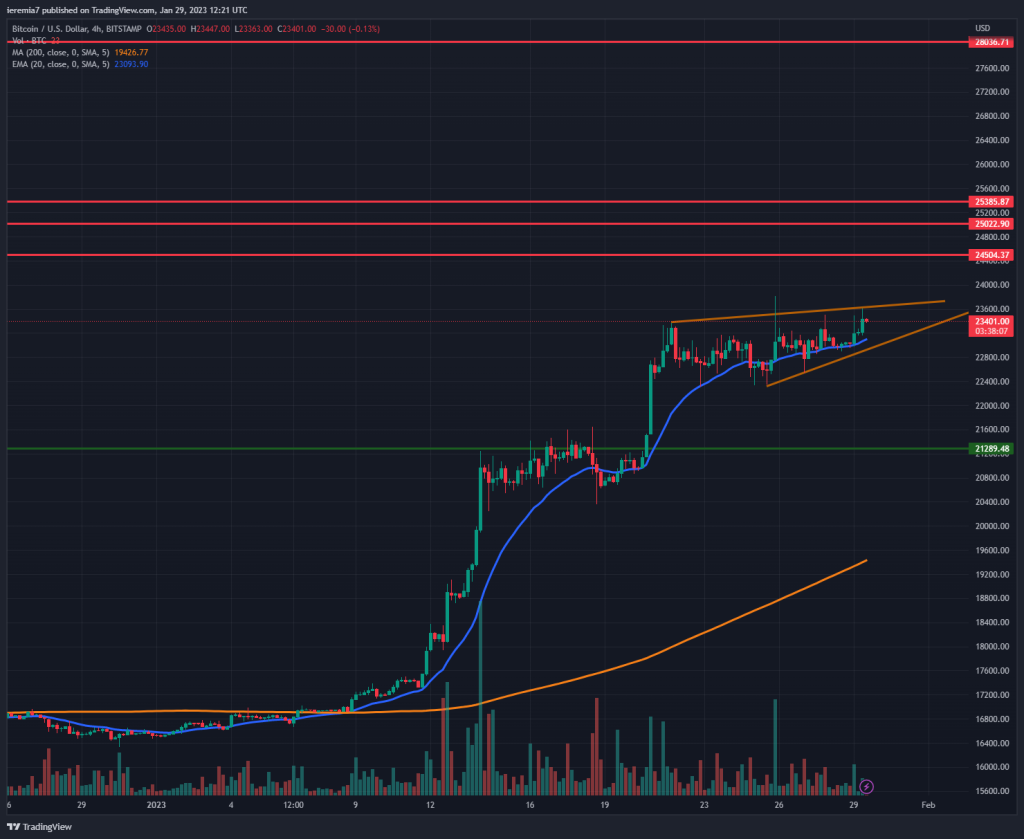
Bitcoin’s bullish momentum continues to slow, as it can be seen on the 4h chart. Although the token is poised to end this week with gains, volumes edging down and a smaller advance on the upside are things to make buyers cautious.
Entering the picture is the Fed’s meeting scheduled to end on Wednesday. That’s an event that could spark Dollar volatility and thus all asset classes will be impacted. Until then, we expect narrow ranges to prevail.
A break above the consolidation structure highlighted in our chart will mean BTC can edge higher. A band of resistance levels emerges, with $24.5k, $25k and $25.3k as key levels to cap the upside. Only breaking above impulsively will open more room toward $28k.
The 4h chart 20 EMA acted as support so far, so if it fails to contain selling, the price can move lower towards $22k and then $21.2k, if buying pressure doesn’t resume. Month-end flows are another factor to consider, given Bitcoin already had an impressive run higher.
ETHUSD (Kraken)
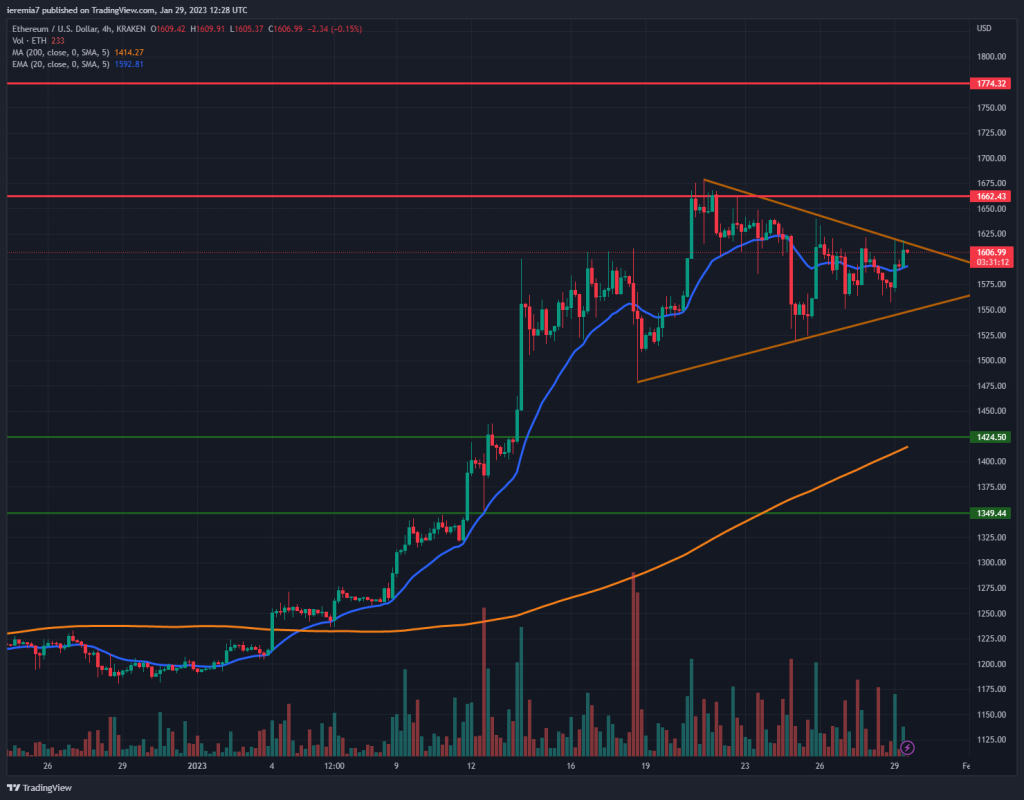
When looking at the Ether price, the consolidation witnessed last week is even more obvious. ETH is now locked inside a triangle structure, which is why traders are waiting to see the direction of the breakout.
Interesting to note is that the upside move stalled around $1,660, which is also a key resistance level on the chart. Buyers need to break above the highs set on January 23 if they want to push the price higher toward $1,800.
On the downside, sellers hold the upper hand on a break below $1,500. That will imply the 200 SMA and the $1,420 support level need to keep the downside in check. Support is also expected near $1,350. A consolidation forming after a bullish impulsive move should be treated as a positive sign, but ultimately, how the triangle breaks will determine the market sentiment.
MATICUSD (Binance)
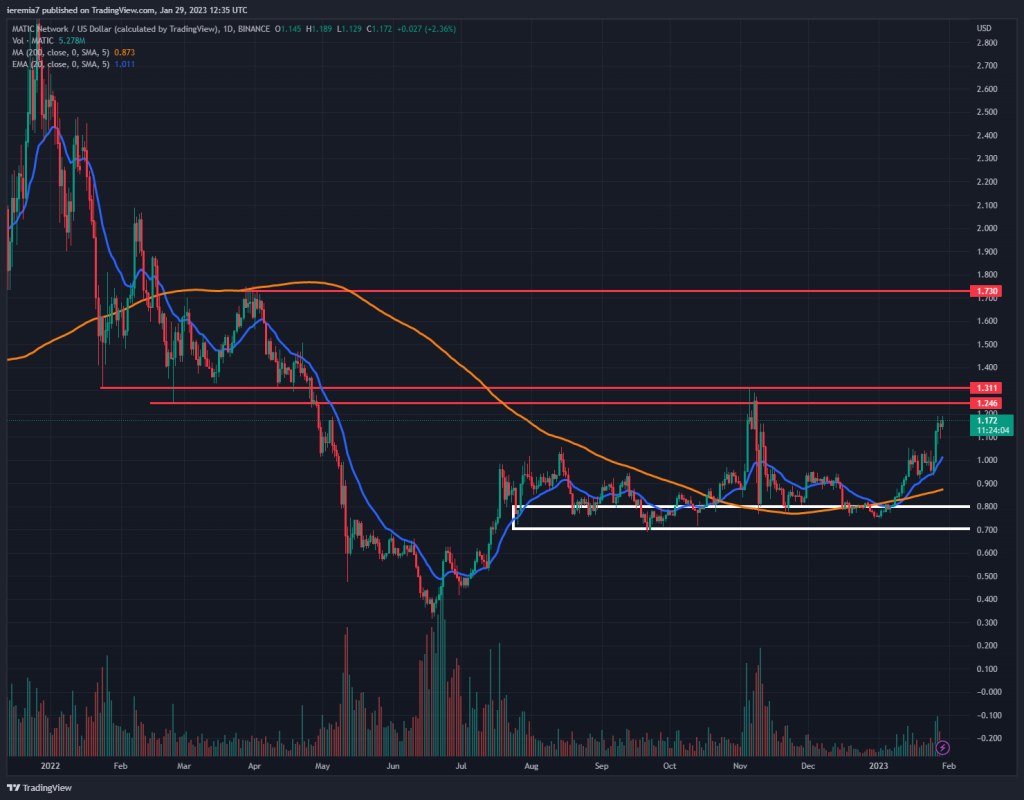
While most major tokens have been consolidating, MATIC is up almost 20% during the last week. Based on the chart, a solid base was formed around 70-80 cents and that should act as a barrier in case renewed selling pressure emerges.
If the move continues to extend on the upside, buyers face a challenge at $1.24-$1.31, since that’s a critical resistance zone. A break higher could drive more bulls in and the price has a clearer path toward $1.7.
For the time being, we believe MATIC is locked in a range between 80 cents and $1.3. Until a break occurs, both sides of the market should proceed with caution. Our sentiment is slightly bullish and only an impulsive breakout below 70 cents can dampen the positive outlook.
You should also keep in mind that MATIC has been trading above the daily 200 SMA for a decent amount of time, suggesting a clear shift in sentiment. Above the orange line and the 20 EMA on the daily chart, buyers are the ones favored.


There are no comments at the moment, do you want to add one?
Write a comment