
BTCUSD (Coinbase)
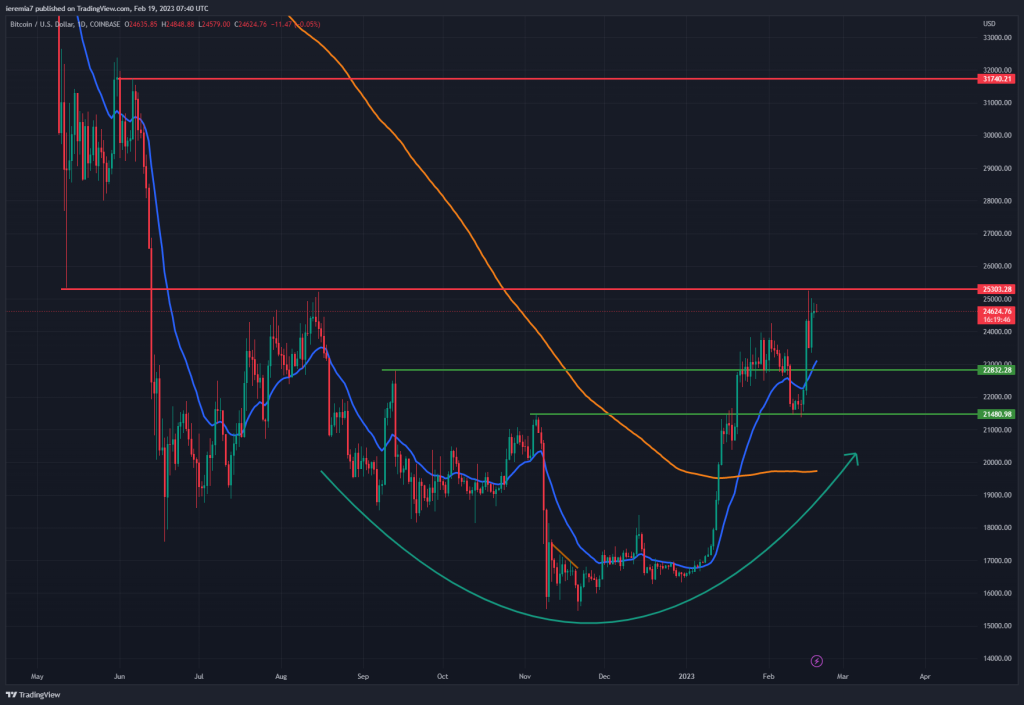
Bitcoin buyers were back in action this week and you can notice how the November 5th, 2022 swing high acted as support. The price bottomed around $21,500 and then shot up toward $25,300, an area we’ve mentioned during the last few weeks. Although buying eased, reaching a new 2023 high is an important development for bulls.
In case $25,300 breaks on the upside, buyers will have a lot more room to deploy their orders, since the next major resistance area stands around $30,000. Technicals are in their favor since the price trades above the 20 EMA and 200 SMA on the daily chart. Higher highs and higher lows are other indications of an imbalanced order flow tilted toward the upside.
We should not ignore the potential for a downside reversal, considering this is still an unstable market. Heavy resistance near $25,300 might be the initial signal for a bearish corrective move. If the price weakens, the 20 EMA and the $23,000 support area are expected to cap the downside. Failure to do that will expose $21,500 again.
ETHUSD (Kraken)
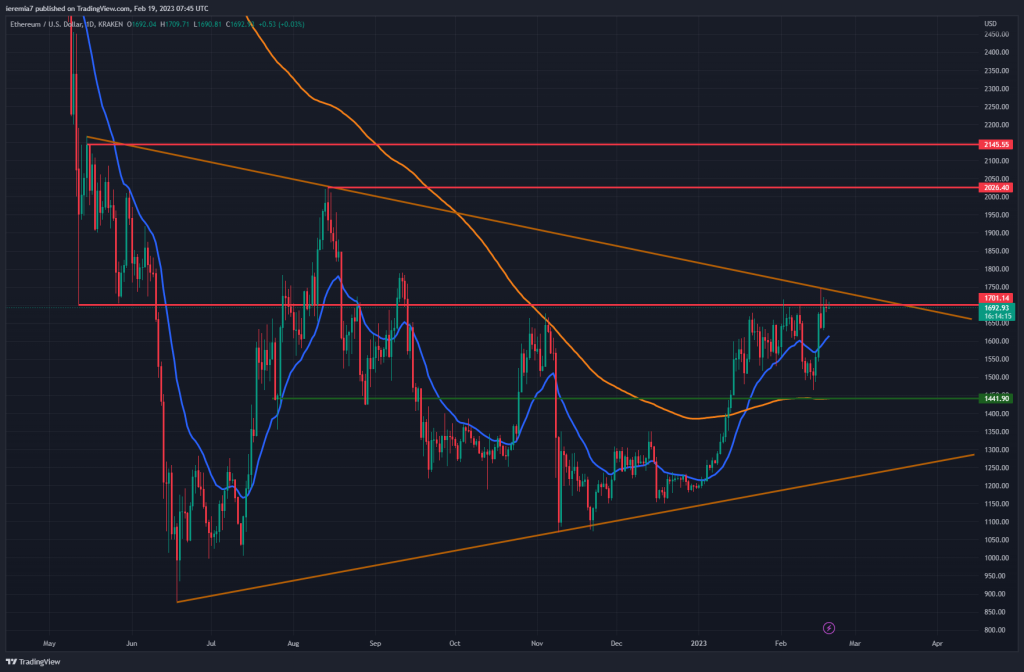
When looking at Ether, the same bounce higher is noticeable on the daily chart. However, the broader picture suggests the price is still locked inside a triangle pattern that goes back to May 2022. This is a major consolidation and once the price breaks on either side, it could unlock a large directional move.
The breakout did not occur yet, which is why traders can continue to play the triangle. The $1,700-$1,750 area acts as upside resistance and we think as long as it’s still not violated, there is a growing probability for a corrective move lower.
If the triangle holds then ETH could weaken toward $1,300 again during the upcoming weeks. On an upside breakout scenario, we expect $2,000 resistance to be a done deal. Due to the volatility compression we are seeing right now, the move higher can go beyond that area once the bullish trend starts to build up. Traders should not have any directional bias at this point, given the consolidative nature of the price action.
MATICUSD (Binance)
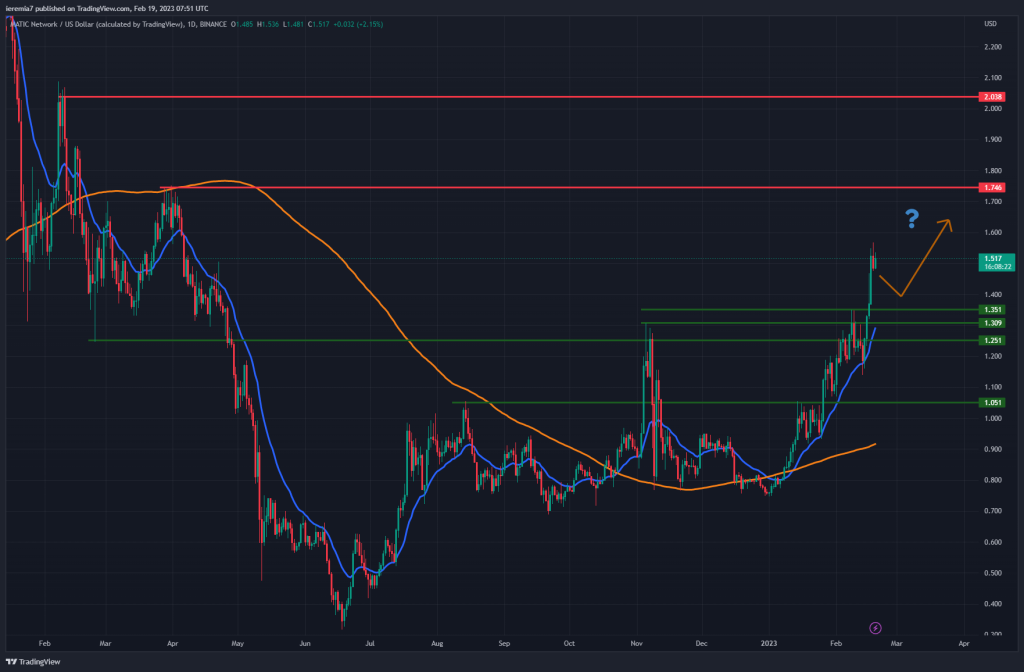
MATIC is leading in terms of gains, up over 20% for the last 7 days. When looking at the chart, we can see the price broke above $1.35, a short-term resistance, and then continued to rocket higher. The bottoming formation is clear and there is room for more upside in the near term.
However, simply because the sentiment is bullish that doesn’t guarantee a straight line to new highs. Buyers wanting to go long should remain patient since these overbought conditions can lead to a correction. From a positional standpoint, it’s much wiser to wait for a pullback toward $1.35 because that’s where the daily 20 EMA also overlaps.
This bullish sentiment will be negated only if the price breaks and holds below the 200 SMA, which is now trading around 92 cents. Sellers have a lot of ground to cover, so we are still favoring buying shallow dips.


There are no comments at the moment, do you want to add one?
Write a comment