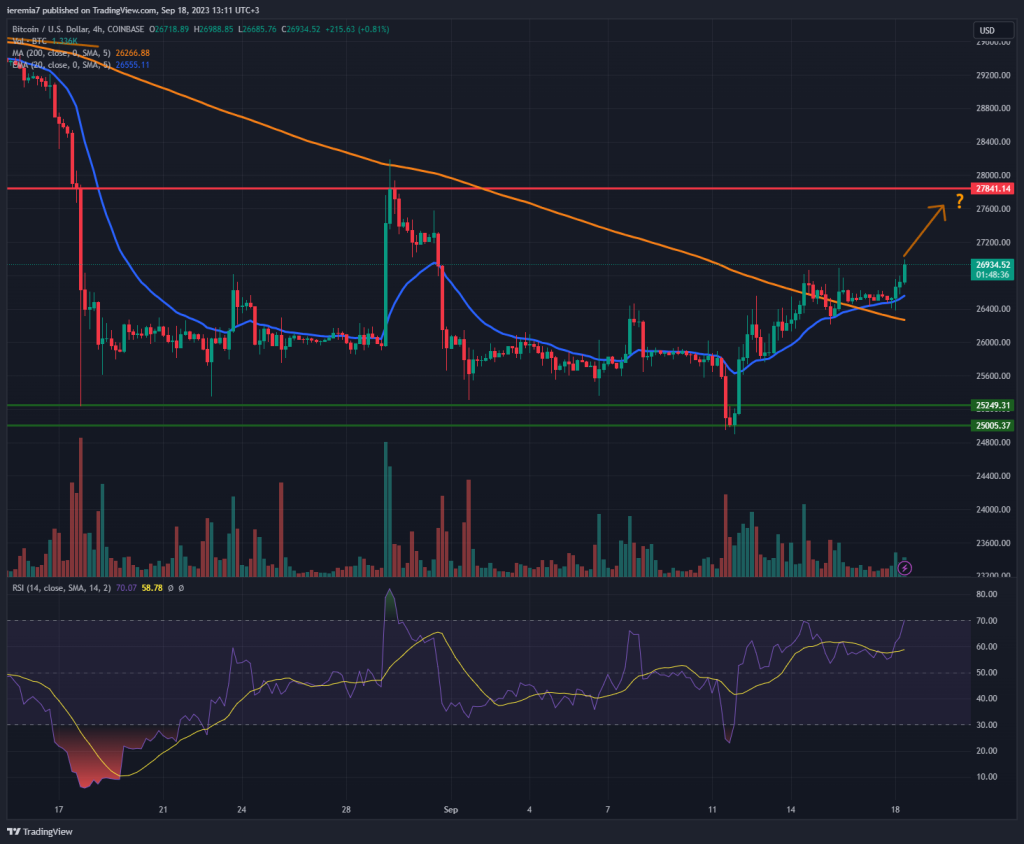
BTCUSD (Coinbase)
Source: TradingView
In line with last week’s projections, $25,000 turned out to be a very strong support area for Bitcoin. As you can see from the chart, that was the starting point for a strong bounce and now it looks like the price action structure has changed in favor of bulls.
We can say that confidently because the price is trading above the 4h chart 20 EMA and 200 SMA. Also, the EMA was treated as support several times, suggesting more gains might follow next. As we’ve pointed out during the last couple of weeks, crypto is entering a bullish seasonal period.
While it’s hard to say the bearish sentiment is behind us, we could at least take a step-by-step approach, guiding based on the latest price action changes. The next area of resistance is located around $27,500. We see a strong push lower starting close to it, so selling orders should be parked there. A break and hold above it will open more room towards $30,000.
On the flip side, the current bullish sentiment will be under threat if the price breaks below the 200 SMA. In that scenario, we could see Bitcoin revisiting the green area of support highlighted on the chart.
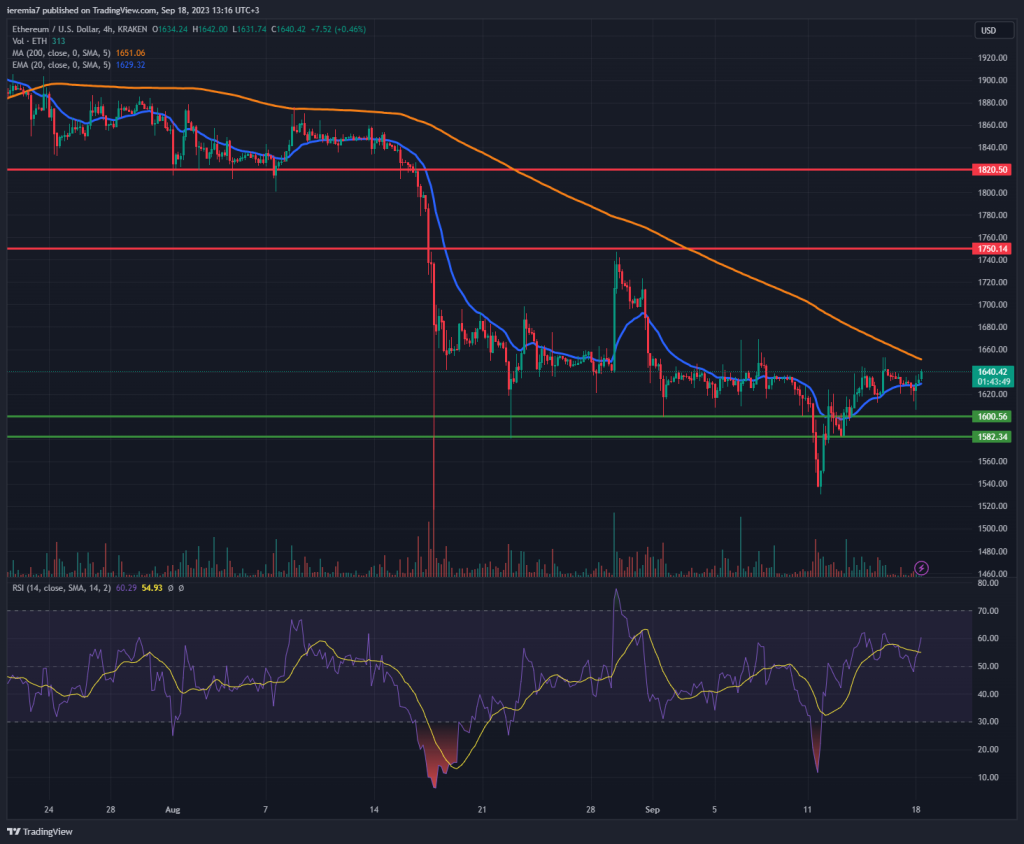
ETHUSD (Kraken)
Source: TradingView
Ether has also managed to recover from the lows, but in this case, the picture is not so favorable for bulls as we’ve seen with Bitcoin. The broader price action still doesn’t suggest buyers are in control for several reasons.
One of them is that ETH continues to trade below the 200 SMA on the 4h chart. Secondly, the price performance has been choppier, since it didn’t retest the lows established in August. Those who were short, targeting the $1,500 are now in a difficult position, especially if their trades are negative.
However, since the market sentiment has improved, we could see more gains this week. We view the $1,580-$1,600 area as support in the face of new bearish pullbacks. Further losses below will revive hopes for a slump towards $1,500. We favor the upside and if buyers clear out the 200 SMA, the next resistance comes at $1,750. That will be a sign of bottoming and more gains should be expected.
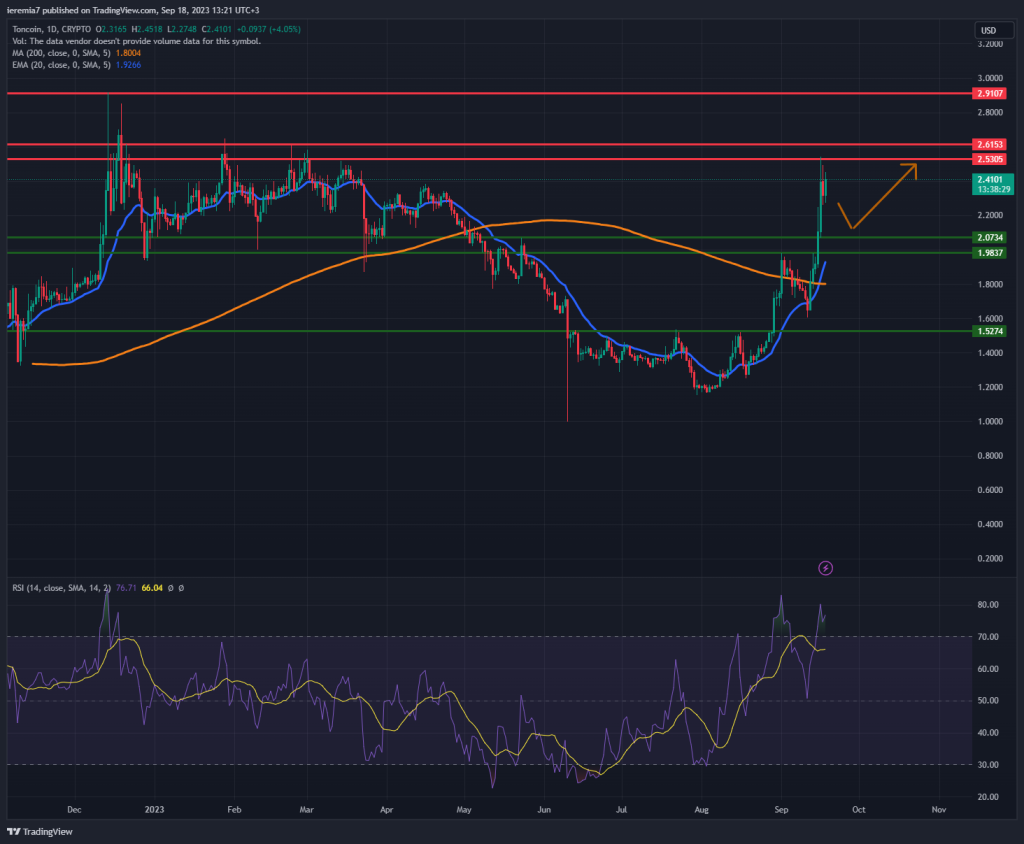
TONUSD (TradingView)
Source: TradingView
A couple of weeks ago we talked about Toncoin and mentioned how a breakout above $1.52 could spur an impulsive rally. The token price rallied impulsively since then and we can see how the price is now retesting a key resistance area.
The sentiment is heavily tilted in favor of bulls, judging by the larger green daily candles. We view $2.53 – $2.6 as a key resistance area and for solid reasons since that’s when the price struggled to break back in February this year. Above that, we could see Toncoin retesting all-time highs.
Pullbacks should not be excluded, because it will mean entering long at better pricing. The key area to watch looks to be $2.07- $1.98. The 20 EMA could also overlap, creating a powerful demand zone for TON. We’ll change our view for this crypto only if the market breaks and holds below the daily 200 SMA.


There are no comments at the moment, do you want to add one?
Write a comment