
BTCUSD (Bitstamp)
Source: TradingView
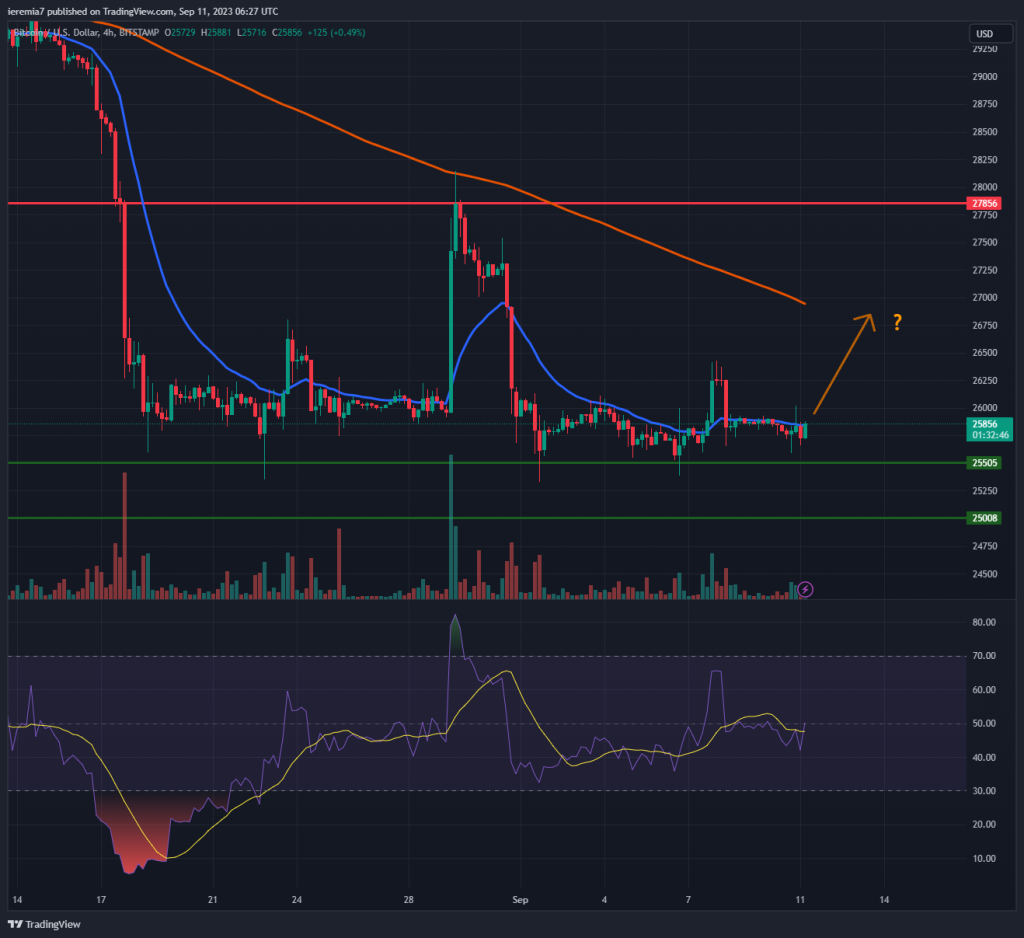
Despite a lack of directional bias last week, Bitcoin is forming a base around $25,500. That’s good news for bulls and as long as the price manages to stay above the level, we see scope for further upside. This is an important week since a new batch of US inflation figures will be released. The event could lead to a spike in volatility across the board, so even crypto trading should be careful.
Technically, we view the $25,500 – $25,000 area as key support in the short term. An impulsive breakout below would open more downside towards $22,500. We are entering a period of positive seasonality for BTC, so it should be no surprise to see selling cooling off. Although it might take a while until bullish sentiment builds up, conditions favor a stronger bounce.
With that being the case, the first upside resistance is that 4h chart 200 SMA. It acted as a cap recently, leading to impulsive selling. Bulls need to see the market treating that line as support, instead of resistance. It will be the first major sign that the order shifted in their favor.
ETHUSD (Kraken)
Source: TradingView
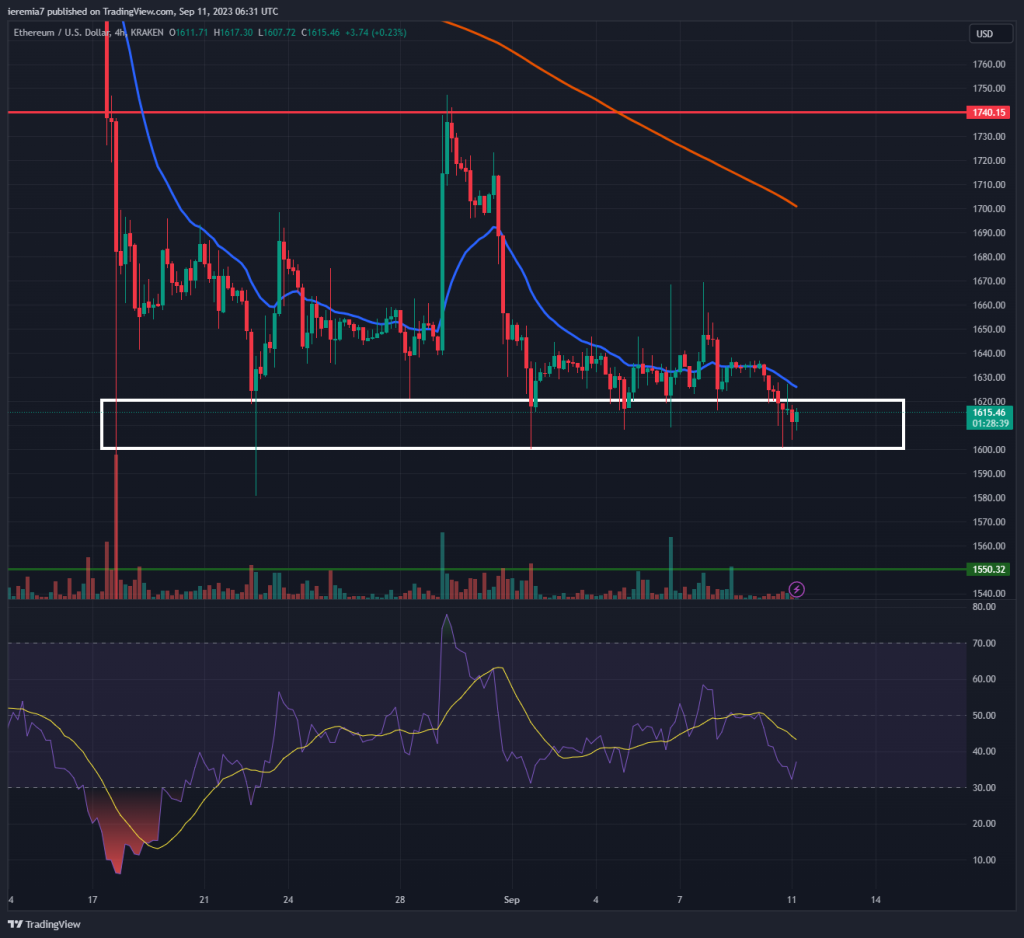
Ether support can be found around $1,620 – $1,600. That area is where we can see multiple bounces during the last couple of weeks. This suggests buyers are willing to buy ETH, preventing further damage from happening. As long as the price stays above, we are supporting a bullish move towards $1,700.
Same as with Bitcoin, the 4h chart 200 SMA is a key level to watch, followed by $1,740. Although impulsive selling has stopped and buyers manage to hold their ground, we are still not confident enough to anticipate a strong directional move up. Instead, we view ETH locked in a range between $1,740 and $1,600. A break on either side will be needed to have more clues on where the market is headed next.
SOLUSD (Coinbase)
Source: TradingView
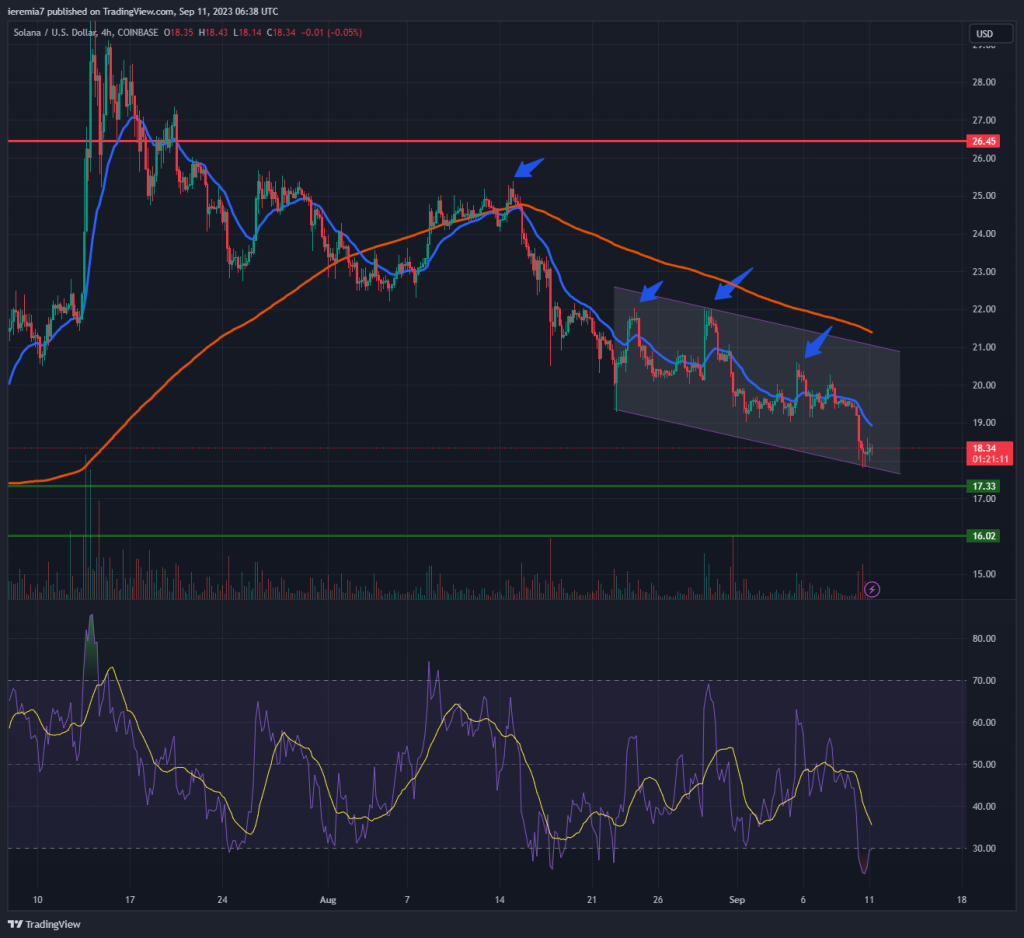
Solana continues to weaken and as of late, the price has been trading inside a bearish channel. That’s not a good sign for people interested in purchasing this coin and the only thing left to do is watch key support areas. From our point of view, $17.3 and $16 are places where bulls could resume impulsively.
However, one should remain patient and not jump the gun the moment the price hits either of those levels. This coin has been falling consistently since late July, suggesting the order flow has been heavily biased towards the sell side.
Until the price action structure changes, we view bounce above the 20 EMA on the 4h chart as selling opportunities. We can see how selling resumed each time that happened during the last couple of weeks.
To see a change in the order flow, SOL should start to rise impulsively above the 20 EMA and then treat it as support. We also need to see the market breaking above the 200 SMA. The RSI is in oversold territory supporting a short-term bounce. We would like to hold and see further developments before making a new trading decision.


There are no comments at the moment, do you want to add one?
Write a comment