BTCUSD (Coinbase)
Source: TradingView
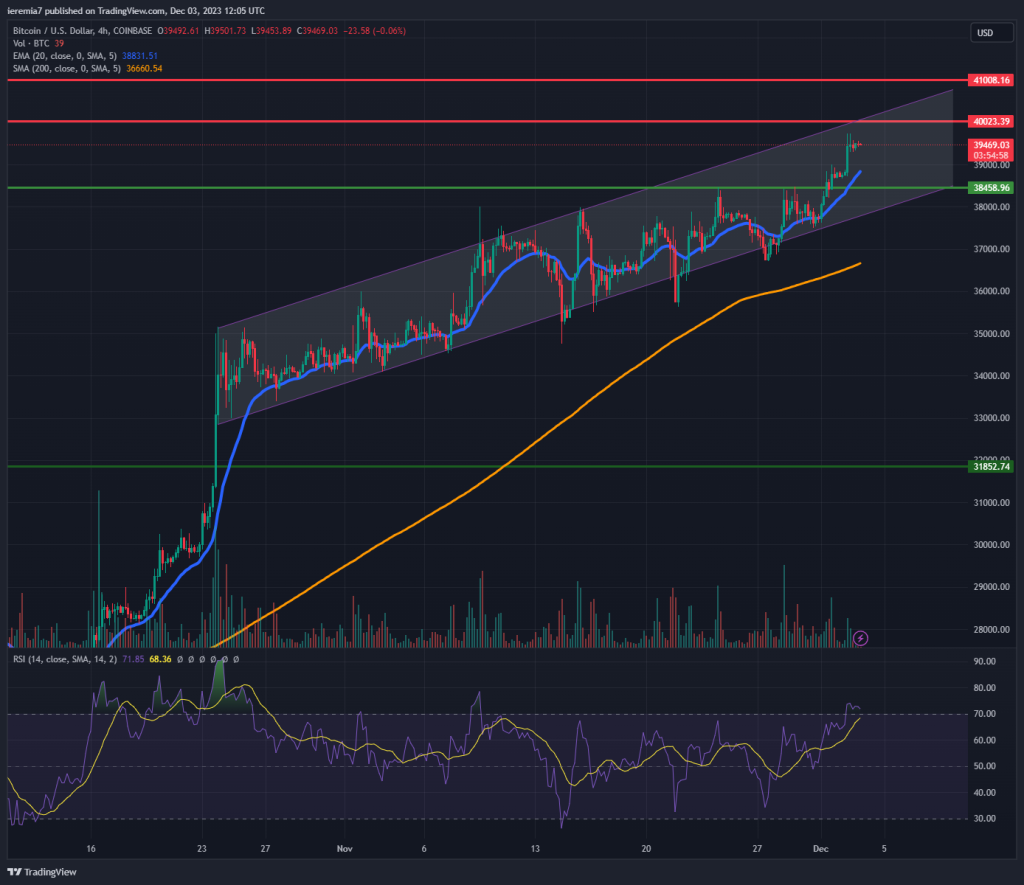
Nothing seems to stop the Bitcoin rally and the market entered the month of December on a positive footing. The bullish channel we have already discussed continues to hold, which is why we can now see BTC inching close to the major $40,000 resistance zone.
When we see the price moving up undeterred by anything, the move generally ends with a blow-off top. Based on that, traders should consider an overshoot above $40,000 before significant profit-taking starts unfolding.
You could watch for hits around $41,000 if buyers push this market beyond $40k. Another interesting thing to note is that we can see some weakness during the next couple of days before the Christmas positive sentiment kicks back in.
Support levels to watch are the 4h chart 20 EMA and then $38,500. You can also notice that the RSI jumped above 70 and that’s normally a sign of overbought conditions. Bitcoin is already up substantially for the year, meaning some players already in heavy profit might take some off the table, leading to a choppier price performance.
ETHUSD (Kraken)
Source: TradingView
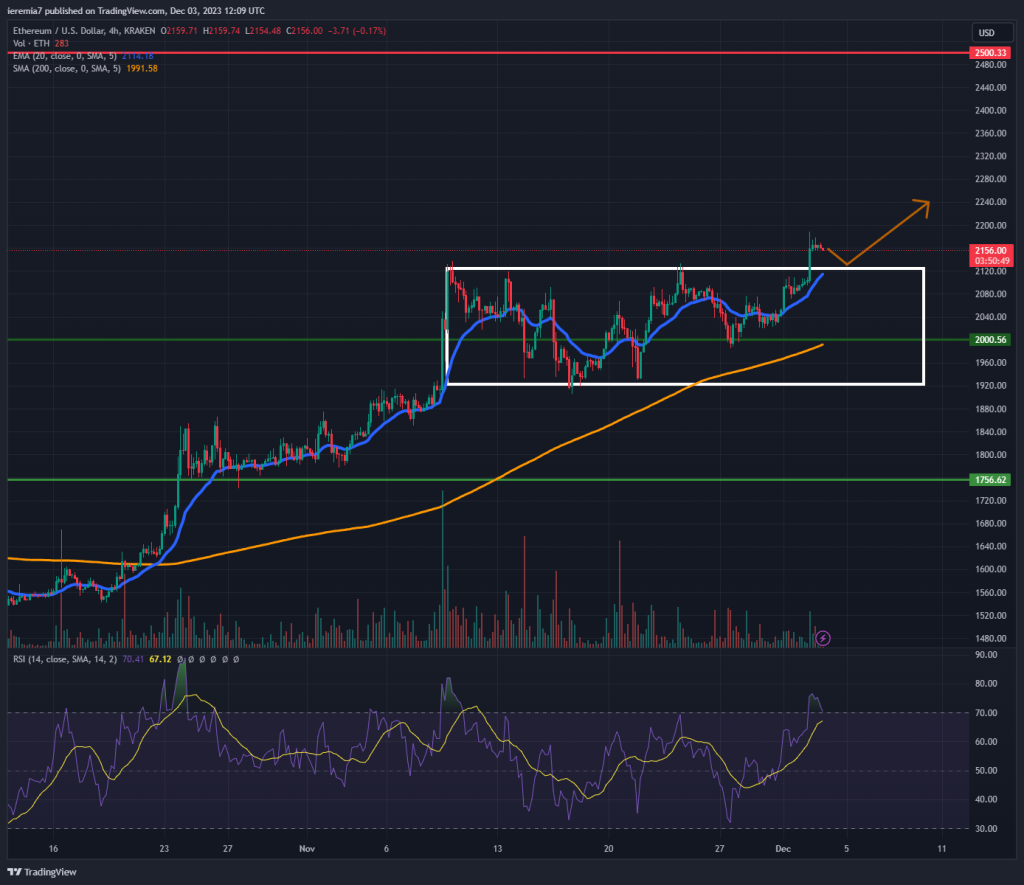
We’ve labeled Ether as an underperformer since it was trading sideways while Bitcoin was making new highs. That’s no longer the case, given the price already broke above the range we mentioned a week ago.
Next, we expect the market to retest the upper side of the structure and then more gains should follow if the sentiment does not deteriorate. Now that ETH has been trading above $2,000 for a decent amount of time, we believe the next major resistance shifted up toward $2,500.
Although it could take more than a few weeks to get there, the path of least resistance is up. All financial markets are cheering a weaker US Dollar and lower Treasury yields. This combination favors risk assets, so until the tide changes, there is no point in front-running a major bearish pullback.
SOLUSD (Coinbase)
Source: TradingView
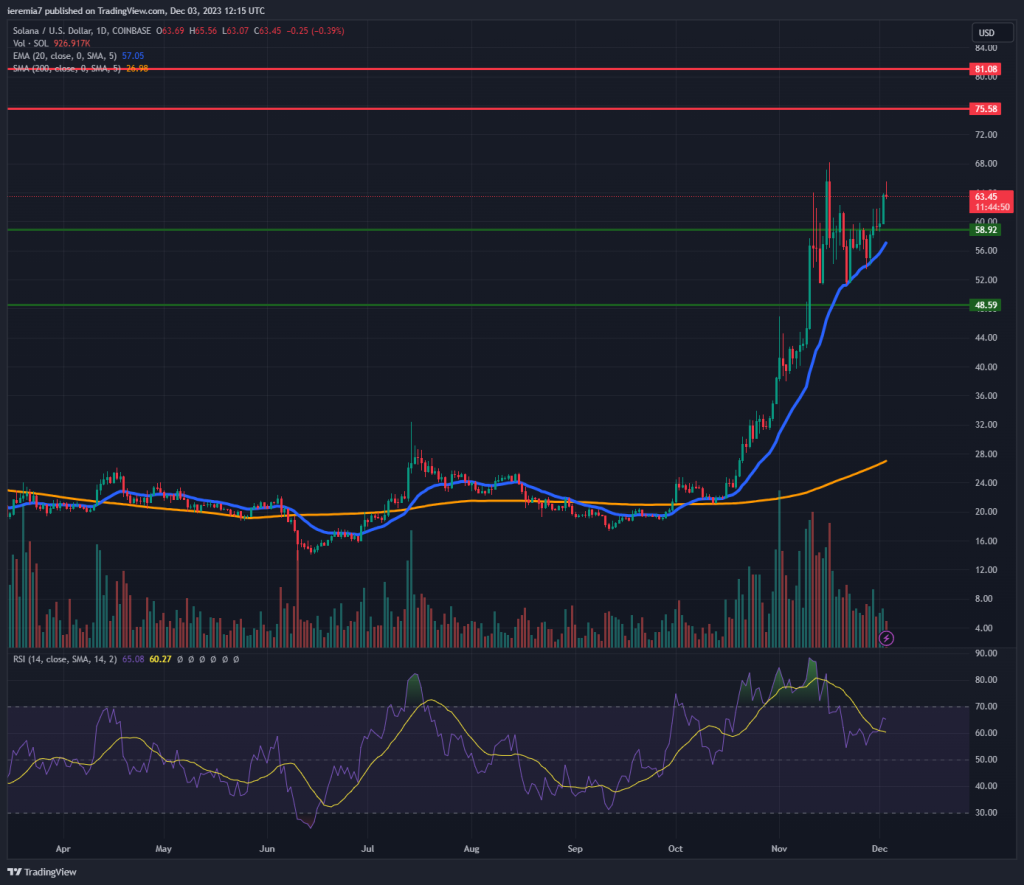
Since mid-October, Solana has been an actively traded altcoin and gains did not fail to show up. The price is pointing upward impulsively, levitating above the daily 20 EMA. More recently, we can see how the price action touched the EMA, which was actually a buy signal.
Buyers are more than eager to buy the dips, meaning there could be more upside left to squeeze. We view $75 and $81 as key resistance zones. That’s where stronger selling could emerge. The RSI already retraced from overbought conditions and now the buyers are in a much better position to push the price higher.
If weakness emerges, traders can watch for opportunities around $59, where the 20 EMA is also located. Breaking and holding below the blue line could signal potential weakness toward the $49 support level. We think the bearish scenario has a lower probability of occurring. However, anything is possible in the crypto, so you should proceed with an open mind. After surging 220% in 45 days, Solana shows a heavy imbalance between the buy and the sell side.


There are no comments at the moment, do you want to add one?
Write a comment