
BTCUSD (Coinbase)
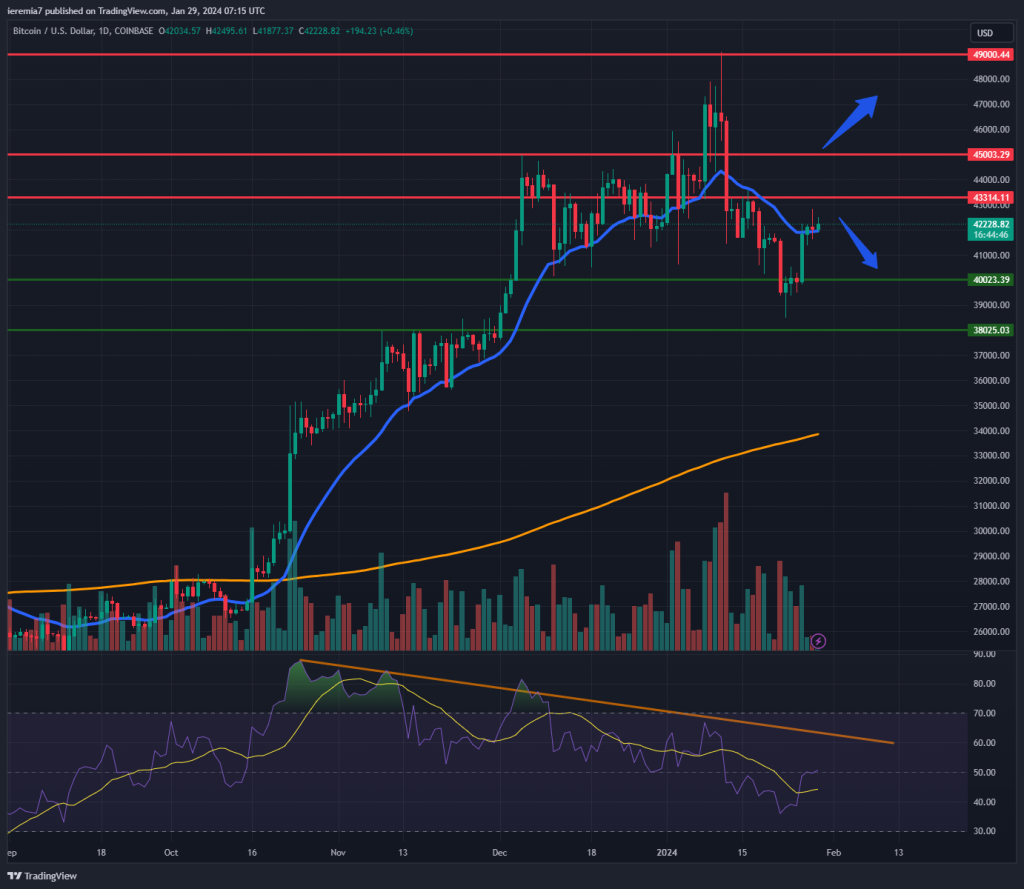
Source: TradingView
Despite a temporary dip below $40,000, the Bitcoin price managed to rebound, communicating buyers were confident to buy around the lows. Although some losses have been erased, we would like to reiterate caution, as some signs continue to point towards uncertainty.
Added to that, you should not forget that this is the FOMC week and tightening financial conditions after the event can lead to Bitcoin weakness. In terms of technicals, the market is not out of the woods yet.
We believe Bitcoin has to break and hold above $43,300 and $45,000 to suggest the bullish trend resumed in full force. Expect more volatility in the upcoming days, as some sellers will view the $45k level as an opportunity to increase downside exposure. Notice the major discrepancy between the RSI and the price action since October 2023. As the market moved up, the RSI made lower highs, which is a divergence.
Renewed selling pressure will force traders to shift their attention back to the $40,000 area. A break below last week’s low will be a bearish development and the downside target will shift to $38,000 + the daily 200 SMA.
ETHUSD (Kraken)
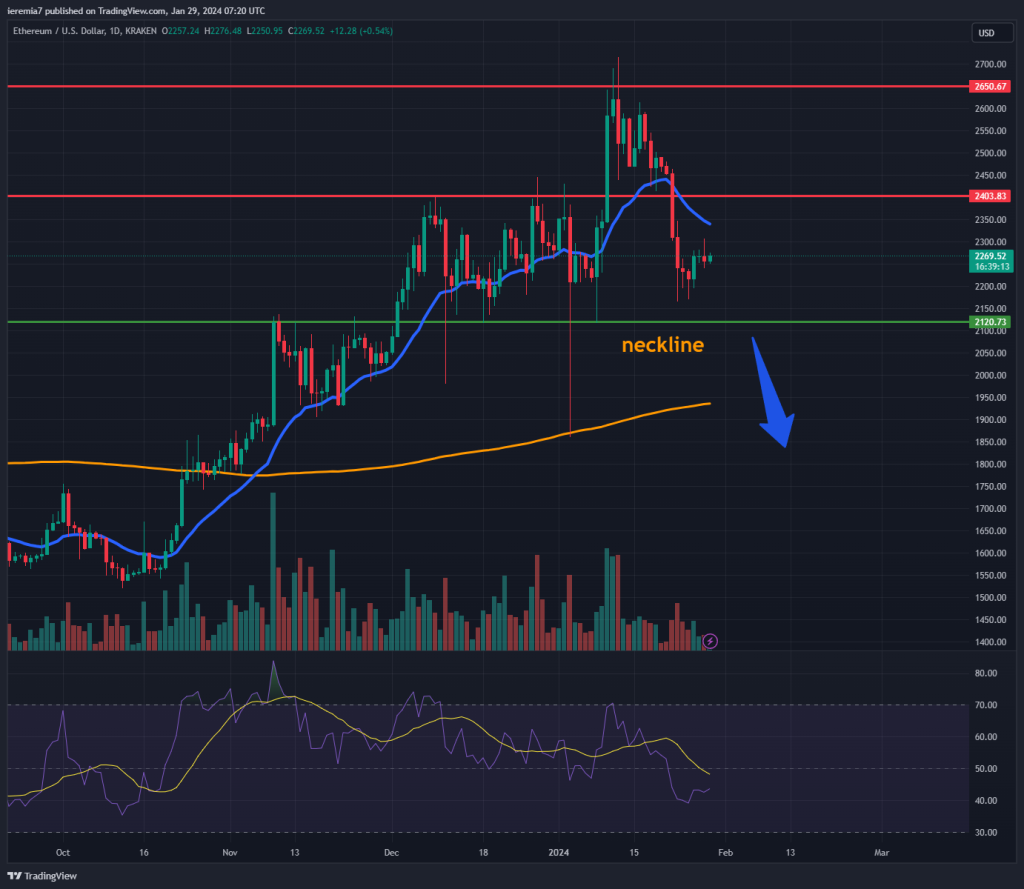
Source: TradingView
Ether is weaker than Bitcoin and based on the latest price action changes, we can now ask whether we are witnessing a head and shoulders pattern. If that will end up being the case, the prospects for this coin are poor, because the downside can extend all the way down to $1,600.
For now, the price is trapped inside a range between $$2,400, which is the top of the shoulder, and $2,120. Buyers need to break impulsively above $2.4k and then push the price towards $2,600 to negate the H&S pattern.
If it doesn’t happen, pressure should mount and the break and hold below $2,120 will be the warning sign. We are aware that the build-up of the left shoulder could take up to a month, similar to what happened with the left shoulder. Based on current conditions, $2,120 should act as support, if we touch it during this week.
SOLUSD (Coinbase)
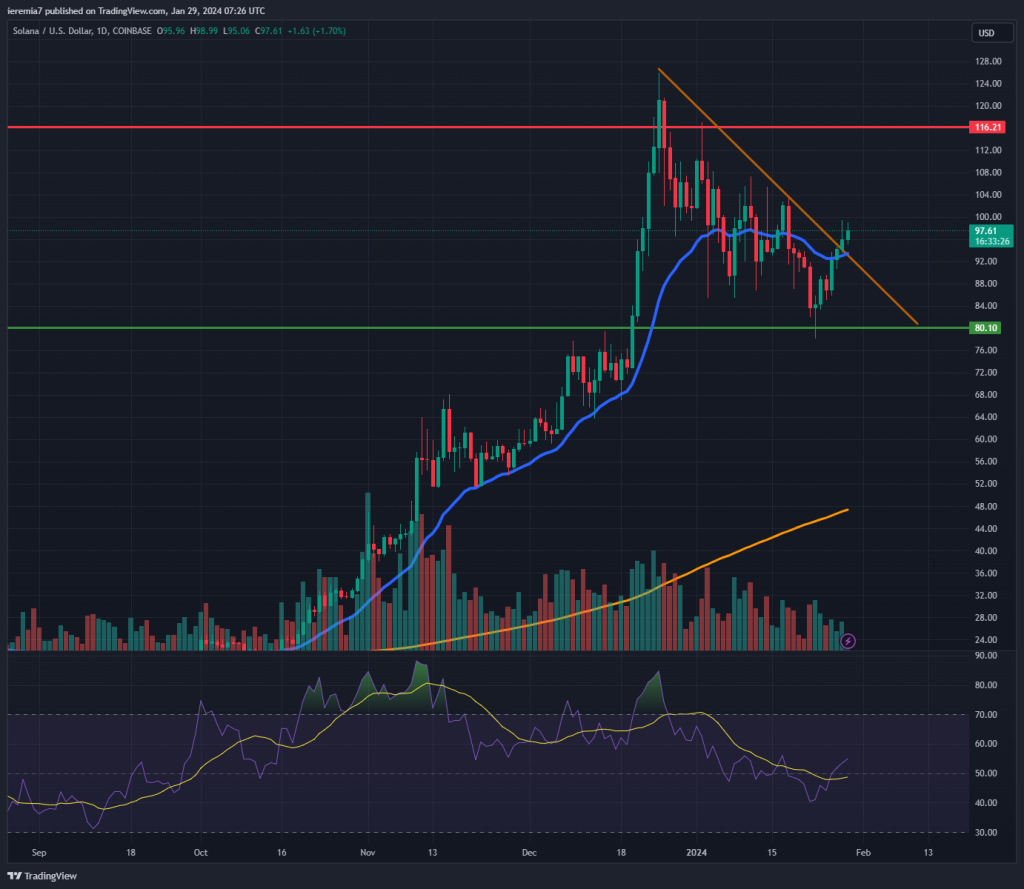
Source: TradingView
Solana rose 8% last week and that means it is one of the major altcoins outperforming Bitcoin. Q4 of 2023 has been very bullish for this coin, but as 2024 started, momentum weakened. Such a strong move on the upside does not end so easily, so a pullback higher is already in the making.
On the bigger picture, the price is locked in a range between $80 and $116. We see how two days ago SOL managed to break above a falling trend line, which is a bullish sign. As long as the price remains above the line, we think the coin has more room on the upside.
Still, the break is not very convincing and traders need to be aware of a false breakout. If selling pressure emerges in force, we should see the $80 back into play. We are cautiously optimistic for Solana and what happens next will also depend on the broader market sentiment. The FOMC can turn all financial markets, but you first need to watch how assets react.


There are no comments at the moment, do you want to add one?
Write a comment