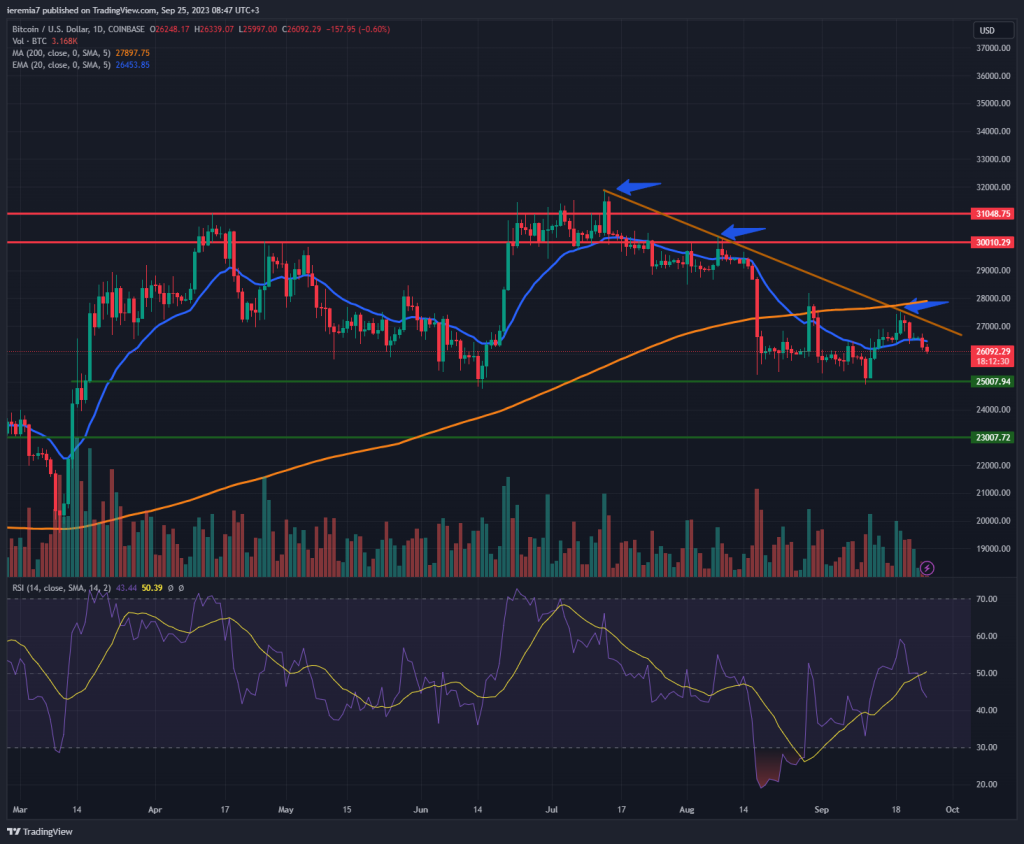
BTCUSD (Coinbase)
Source: TradingView
Bitcoin’s bullish momentum stalled and as we can see from the chart, the picture doesn’t look good for buyers. A trend line going back to July when the downturn started continues to cap the upside, which means the price is locked in between $27,000 and $25,000 for now.
Tech stocks tumbled impulsively last week and that poor sentiment seems to have spread into the crypto space. The fact that Bitcoin is still trading below the daily 200 SMA is a sign of worry and that hints at some further pain in the near term.
The $25,000 area is key in case selling will continue to extend this week. If buyers can’t hold the line, we could view a spike lower towards $23,000. Price action shows a deterioration of risk sentiment and we don’t view current conditions as ideal to make any purchases.
On the flip side, a breakout above the bearish trend line could be the green light buyers are waiting for. In that scenario, we view an increased probability of a $30,000 retest. However, we currently favor the downside, given there’s little interest in BTC buying.
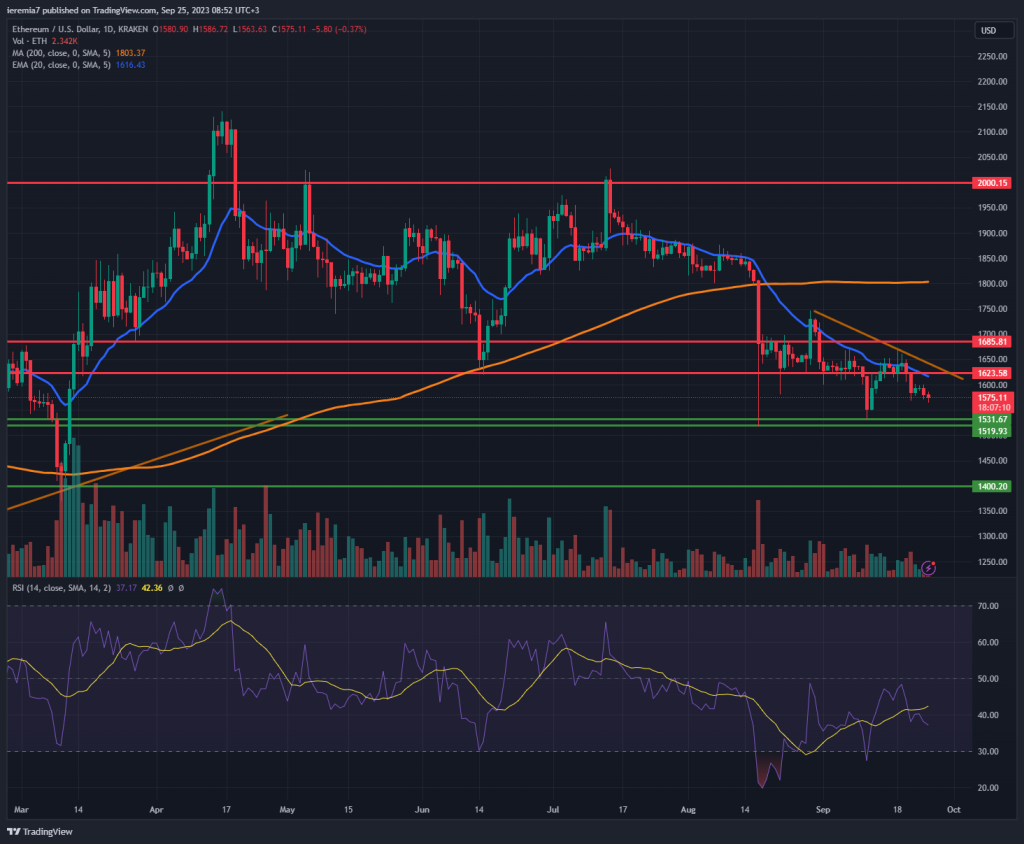
ETHUSD (Kraken)
Source: TradingView
Ether is in a poorer technical position, considering the daily 20 EMA acts as a cap each time the market attempts a bounce. Sellers hold the upper hand, which is why we believe the price could continue lower and retest the lows established on August 17th. That makes the $1,500 a key support to hold, if bulls want to attempt a rebound.
A bearish parabolic structure combined with a limited buying appetite is not a favorable picture for buyers. That’s why we think the risk of a further slump towards $1,400 has increased. Although that target could take more than a week to reach, bears should continue to dominate.
We expect a breakout above $1,650 to confirm bullish appetite resumed. In that case, Ether could rebound towards $1,800. Be aware that bottoming formations take some time, so you might have to wait patiently until a proper bullish setup pops up on the chart.
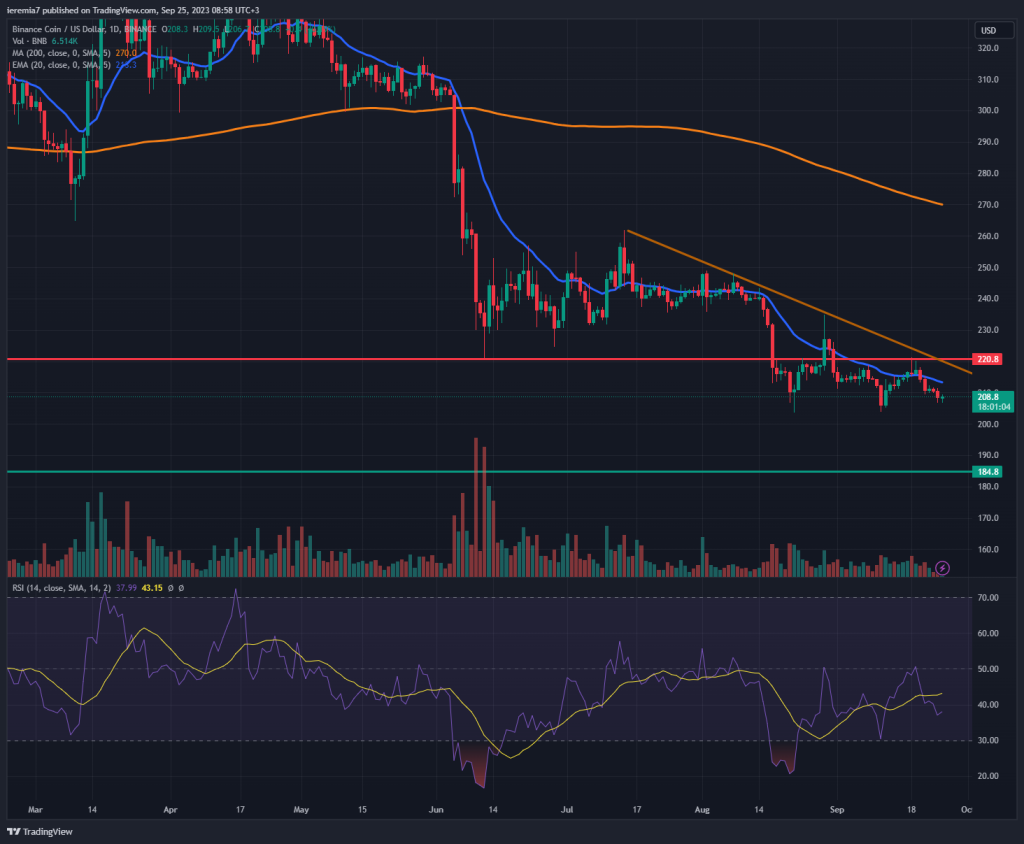
BNBUSD (Binance Coin)
Source: TradingView
Shorting BNB remains the most appropriate trade, considering the price remains in a downturn. We see no sign of bottoming right now, which means more pain ahead could await. Lower lows and lower highs are indicative of a bearish market and because of that, we think the price will continue to fall towards the $185 area.
That’s a major support and should spark at least some profit-taking. Further selling below will open more room towards $150. Binance is an exchange witnessing a structural decline that could accelerate if crypto ETFs are approved in the United States. The market is frontrunning such an event, believing that will impact the exchange business.
The first bullish sign to watch is a breakout and hold above $220. That could show a renewed appetite for buying. Unfortunately, we don’t expect that to happen this week, given how weak the sentiment currently is. Very likely, sellers will view any short-term bounce as an opportunity to continue reducing their BNB exposure.


There are no comments at the moment, do you want to add one?
Write a comment