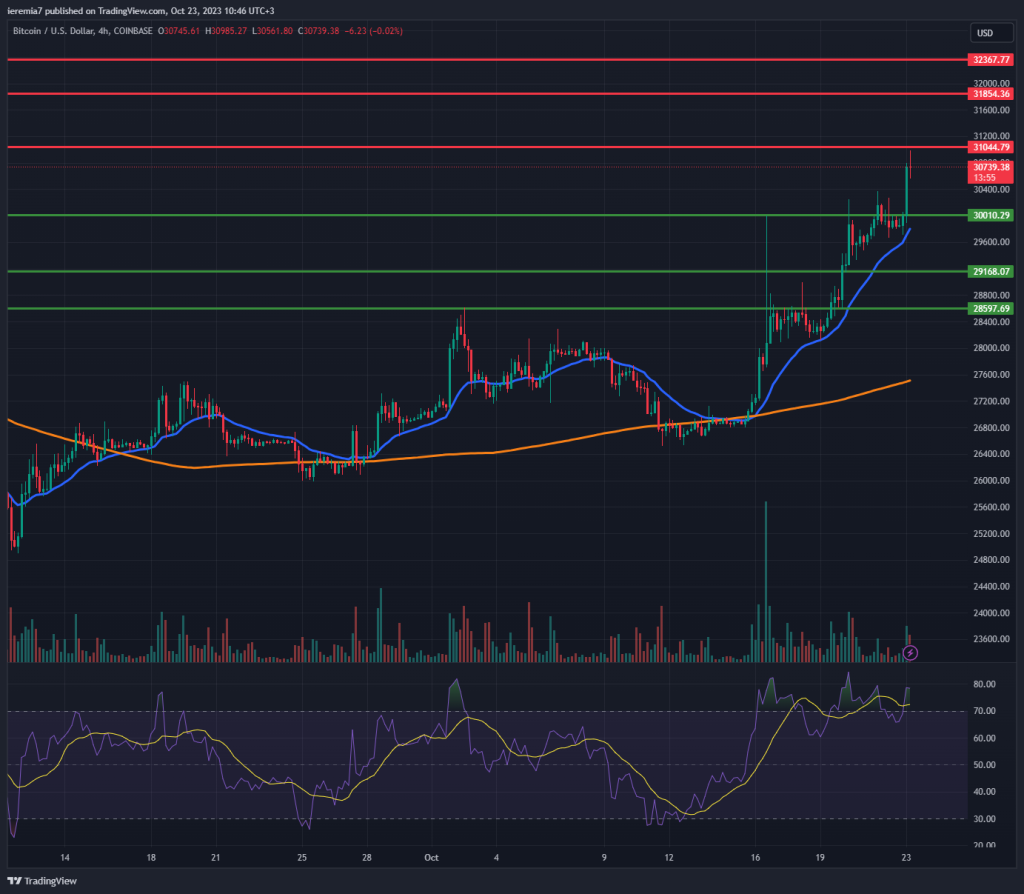
BTCUSD (Coinbase)
Source: TradingView
Although tensions in the Middle East have not abated and there are high uncertainties over how the situation will play out, market participants are seeing Bitcoin as a safe-haven. Bonds and stocks were down last week, yet BTC surged impressively, breaking above our $30,000 psychological level.
Even though it’s odd to see volatile instruments outperform in such an environment, fighting the trend doesn’t look like the best approach. Instead, traders should carefully watch how the price action unfolds, especially whether corrective moves are shallow. Weak pullbacks towards $30k and $29k could be potential buying opportunities.
Our main upside targets are $31k, $31.8k and $32.4k. Although the bullish surge is tempting for many, we advise caution and avoid purchasing at the highest price. If the conflict spreads across the Middle East, that could be a situation in which even Bitcoin starts selling. The 4h chart 200 SMA located at $27,600 is the dividing line between bullish and bearish territory.
Only on an impulsive break below it, our sentiment will shift to bearish. As you can see, there is not a lot of upside at this point, but plenty of downside risks.
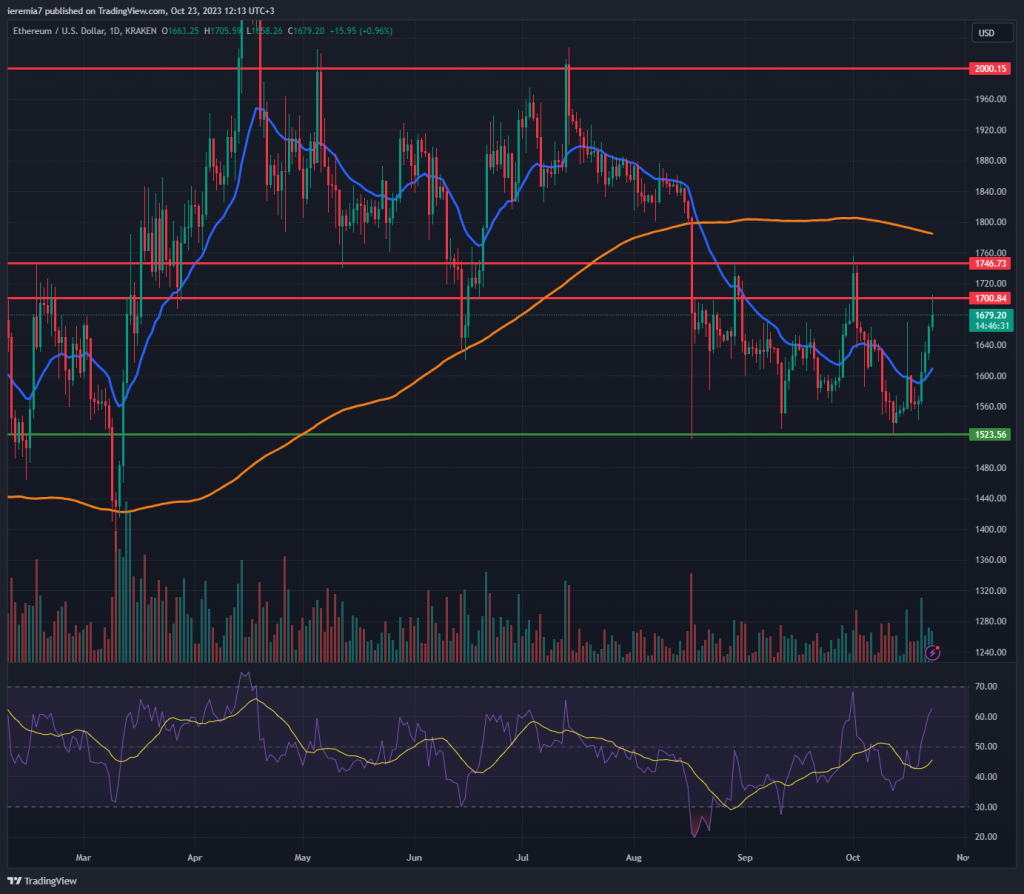
ETHUSD (Kraken)
Source: TradingView
Ether is up 4 consecutive days in a row, following the BTC’s path. However, as of today, the price seems to be treating the $1,700 as a key resistance line. Because of that, we believe there is scope for a pullback lower, especially if the sentiment will weaken across the board.
Despite the spike higher, overall financial conditions are not favorable. Long-term US yields continue to rise, with a major impact on the stock market and boosting the USD. Traders should not rule out strong selling pressure in the days ahead.
The first important support is the daily 20 EMA. Below it, we are in bearish territory. The range between $1,520 and $1,740 we have discussed in the past remains in play. A break below $1,500 is a negative sign that could incentivize new sellers.
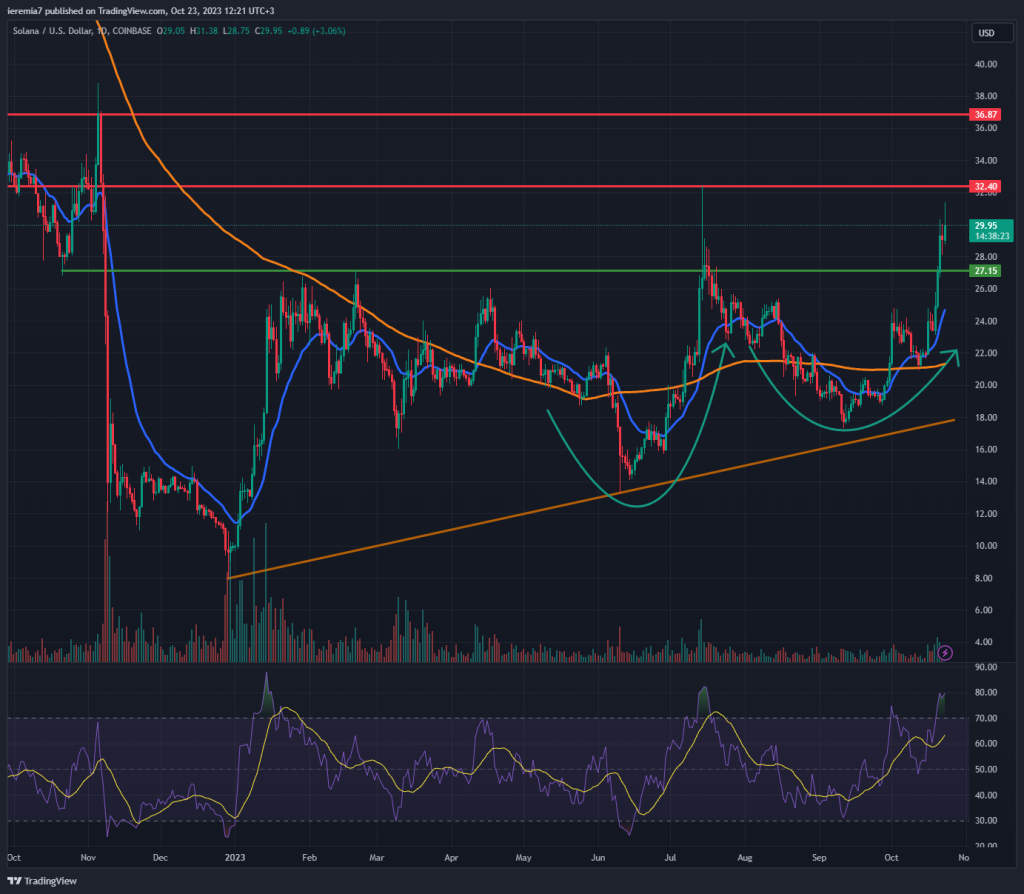
SOLUSD (Coinbase)
Source: TradingView
Solana is up over 32% on a weekly basis, supported by the bullish sentiment seen across the market. When analyzing the price action, we can notice a classic bottoming formation, since every bearish correction is followed by parabolic buying.
Such conditions are pointing for a continuation higher and we suspect the next key resistance is around the $32 area. If the market breaks above it, we could see SOL heading towards $37. The market trades well above the daily 200 SMA and the last couple of days have been dominated by bulls.
That’s not a reason to become complacent. Traders who are waiting on the sidelines should watch for short-term pullbacks. The $27 support is the first major line on our chart, followed by the daily 20 EMA.
The fact that SOL is outperforming Bitcoin and the other major coins is an encouraging sign, especially if the bullish move continues to extend. Keep in mind that it will be challenging to manage a trade if these conditions change and the price action gets choppy.


There are no comments at the moment, do you want to add one?
Write a comment