
BTCUSD (Coinbase)
Source: TradingView
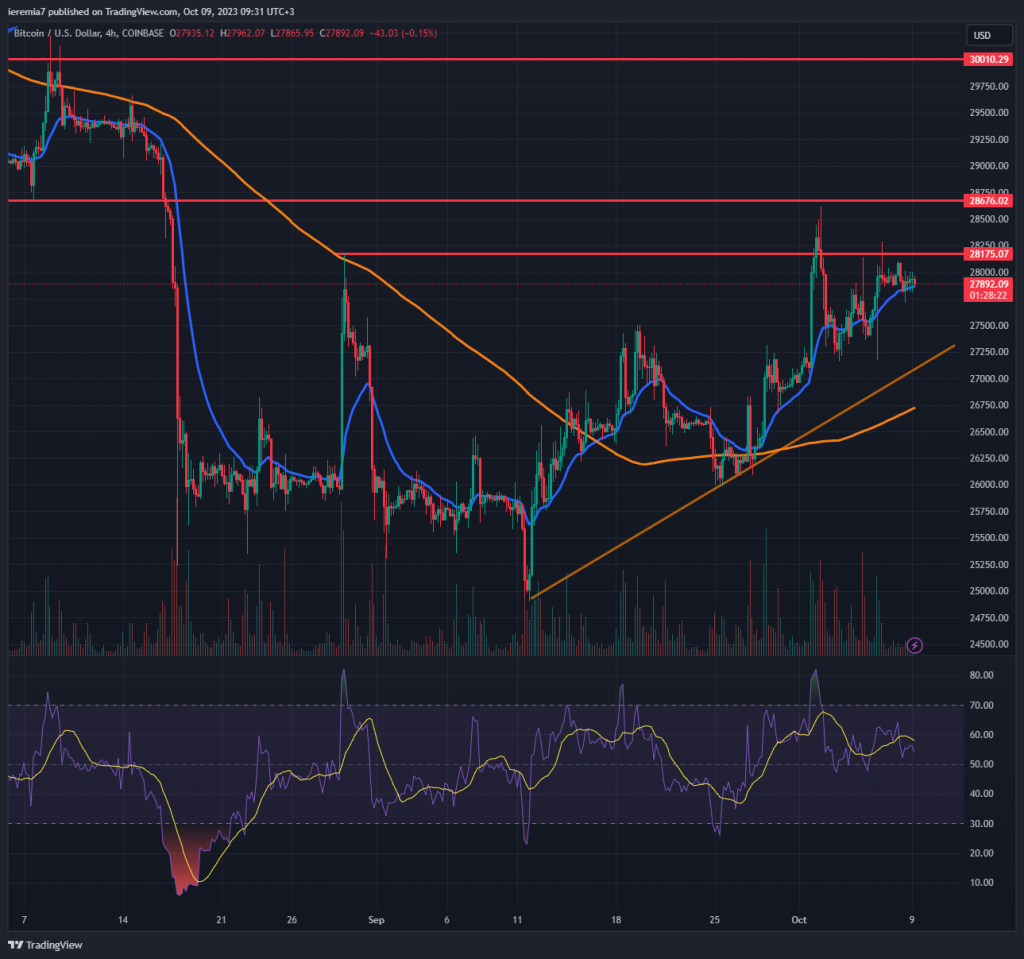
Bitcoin’s positive seasonality is leading the charge, as we see the price pointing upward. The bottoming seems to be completed, given the market respects an ascending trend line and we see higher highs/higher lows.
The price cleared the resistance around $28,200, corrected lower, but now we see how buyers are squeezing the market close to that area. This classic pre-breakout formation suggests there is scope for further upside in the near term.
Other financial markets have gapped down after tensions in the Middle East, yet that doesn’t seem to impact BTC thus far. We are bullish while the price continues to trade above the 4h chart 200 SMA + the trend line.
As sellers are gradually squeezed out of the market, we could see the $30,000 key area revisited in a matter of weeks, or even sooner. Those who want to short Bitcoin, aiming to profit from a fall, might want to wait for further clues that the sentiment has deteriorated substantially.
An early sign of weakness would be breaking below $26,500. In that scenario, the $25,000 could be under pressure again. However, as the market sticks to the script, going up in October, this isn’t the right time for selling.
ETHUSD (Kraken)
Source: TradingView
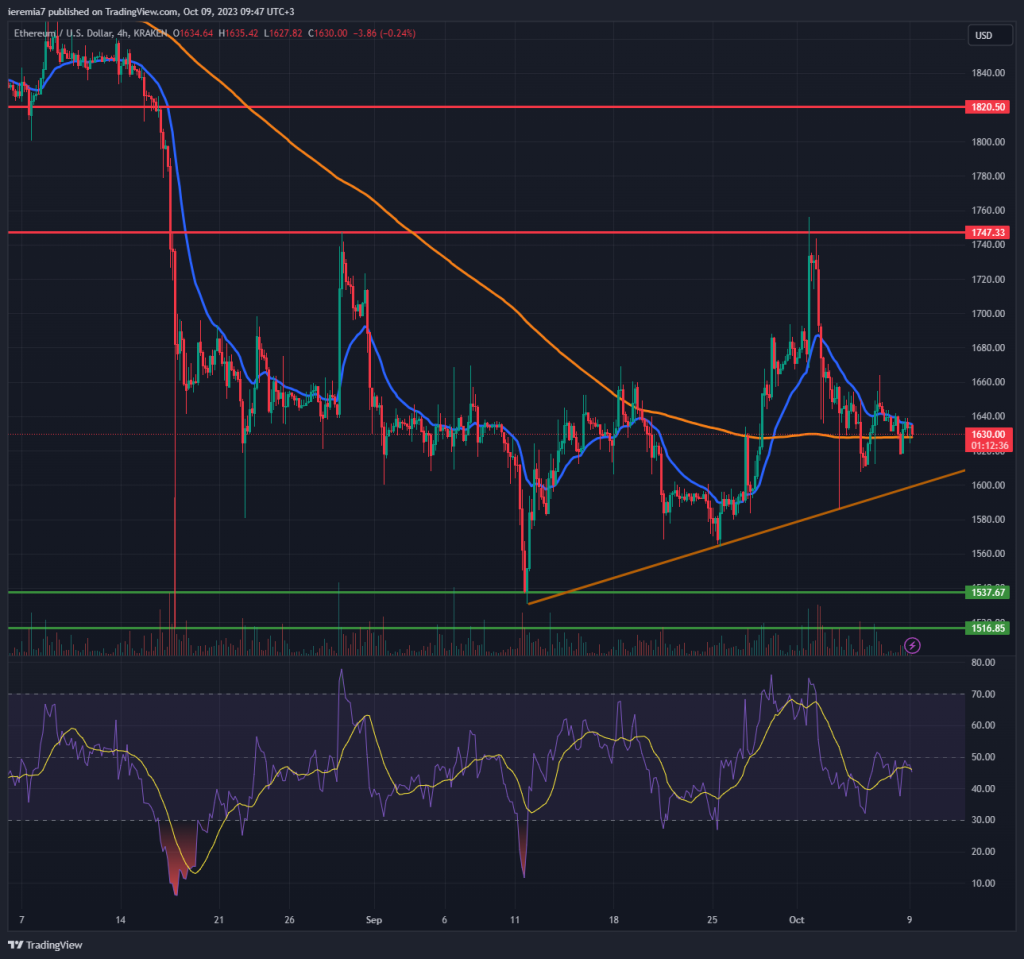
Ether doesn’t seem to enjoy the same positive flow as Bitcoin, considering the price is not showing any sign of bottoming yet. It would be fair to assume that we are dealing with a range between $1,750 and $1,520. A breakout on either side will confirm the market chose a side and only then traders could start chasing it.
At this stage, though, we are reluctant to place any trades. However, watching key areas on the chart is the only way to spot accurate setups. Breaking below the 4h chart 200 SMA will be faced by a short-term support around the ascending trend line.
Further losses below that line will mean Ether is poised to retest the lower bound of our range. We expect losses to be contained around $1,500, since buyers will be incentivized to set in. On the upside, $1,750 remains the near-term resistance. Breaking above would be a good development and that will increase the probability of a retest of $2,000.
LINKUSD (Kraken)
Source: TradingView
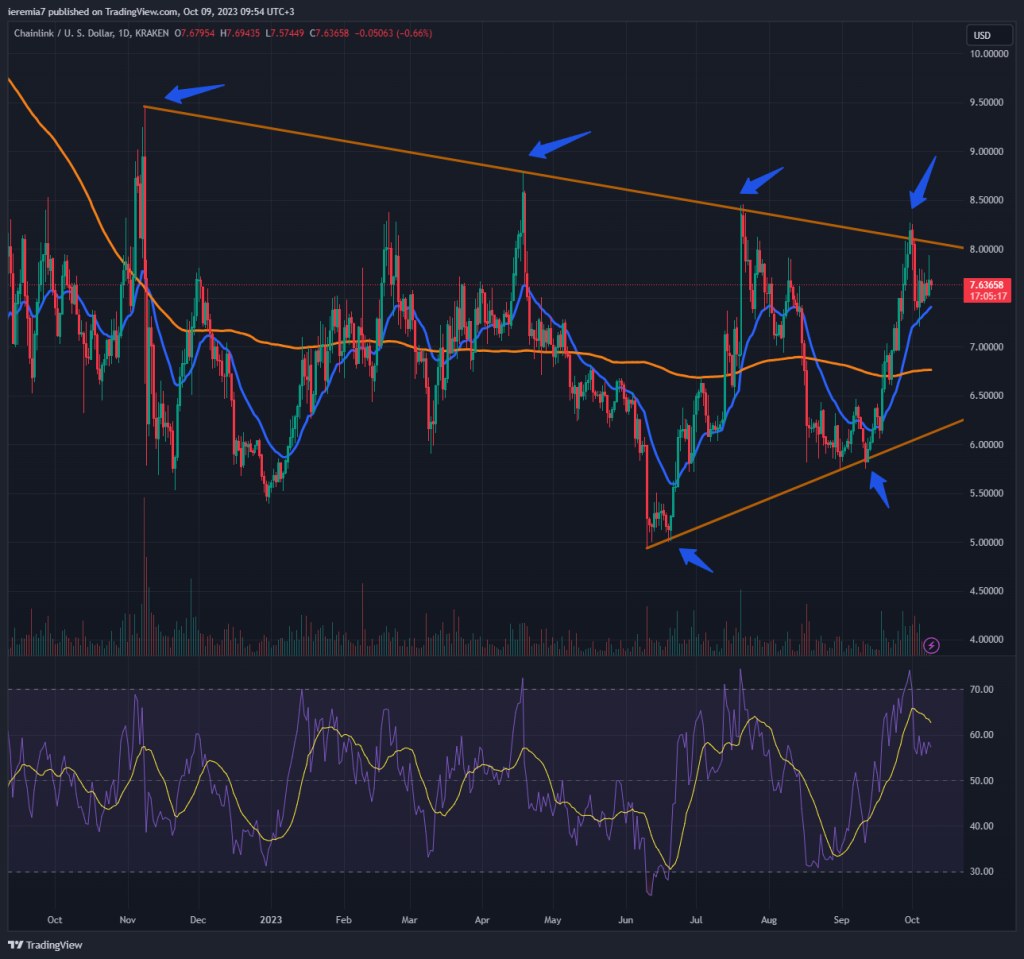
Chainlink is down approximately 5% during the last week and when looking at the chart, we see that the price is stuck inside a triangle formation. Although the buying has been intense, sellers resumed in force once the price reached the upper side of the structure.
For now, buyers treated the daily 20 EMA as support, which could mean a new push up could follow. However, bulls should proceed with caution, considering thus far buying is quite weak. We think there is a greater risk for a pullback lower.
In that scenario, the daily 200 SMA might act as support. Further selling below will expose the lower side of the triangle. An upside break above the triangle would be a bullish development for LINK and should open up more room towards $10. Until it happens, the coins are poised for increased volatility inside the triangle.


There are no comments at the moment, do you want to add one?
Write a comment