
BTCUSD (Coinbase)
TradingView
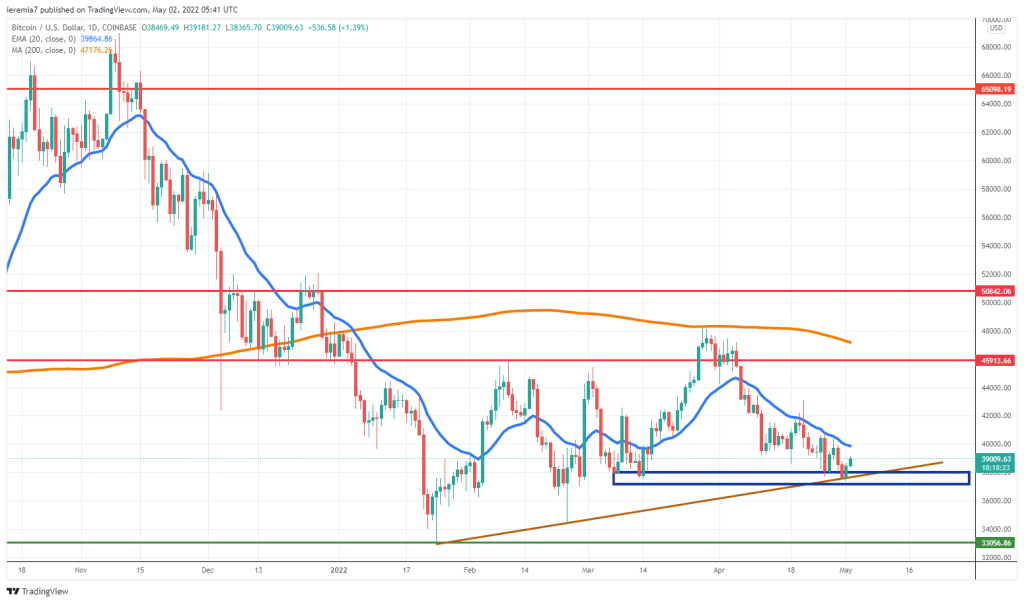
Bitcoin continued to grind lower last week and managed to reach the short-term ascending trend line we’ve talked about. However, since the selloff has not accelerated, now the price seems to be correcting higher, even though we are not yet out of the woods.
The area around $38k and $37k remains critical and a breach below that will expose the January 2022 lows around $33k. Last week did not end in a positive fashion, which is why we could see sustained BTC weakness in the month of May as well, given seasonality is not supportive.
On the upside, watch how the price reacts to the daily 20 EMA. Thus far it has been treated as resistance and as long as that relationship does not end, sellers will remain in control. A break higher can push Bitcoin towards the $42k area initially, while a larger correction higher can open more room towards $46k.
ETHUSD (Kraken)
Source: TradingView
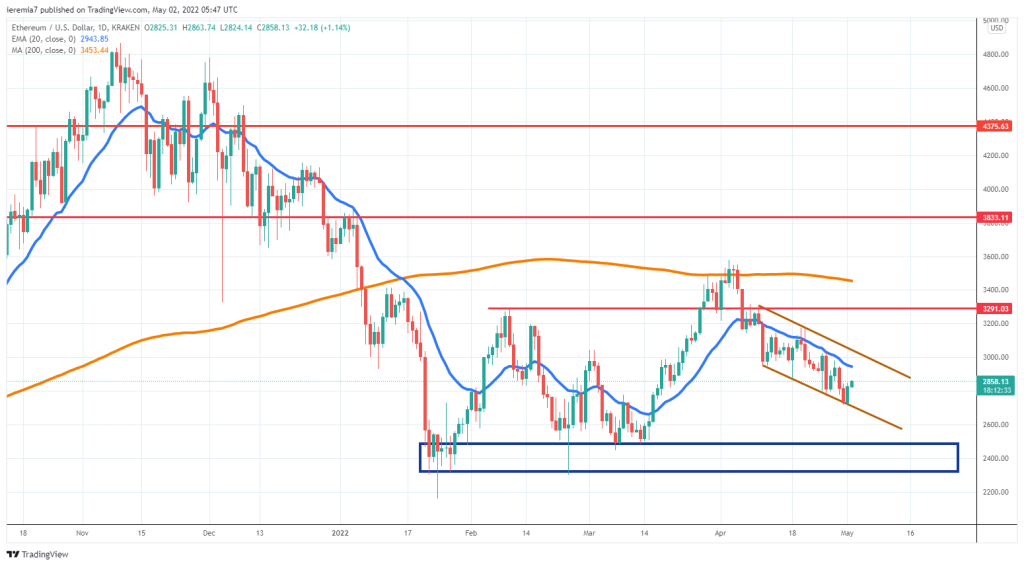
Ether is closely correlated with Bitcoin and once again we see the same slow grind lower, suggesting the sellers are still in control over the order flow, despite not managing to push the market towards the 2022 lows at an accelerated pace.
A descending channel seems to be respected by both bulls and bears, so until the structure is breached, it might be possible to play the range. Our near-term target is located around $2.5k and only a break and hold above the daily 20 EMA can negate it.
Conversely, breaking below the channel will be a bearish sign and Ether can slump towards the blue support area we’ve highlighted. It’s the FED week once again and hawkish comments from the most important central bank, beyond what’s already priced in, can exacerbate the upside on the Dollar, and put further pressure on risk assets, including cryptocurrencies such as Ether.
We keep our bearish view in place as long as ETH trades below the daily 200 SMA, which is now located around $3.5k. That seems like far away until bulls can be in charge.
AVAXUSD (TradingView)
Source: TradingView
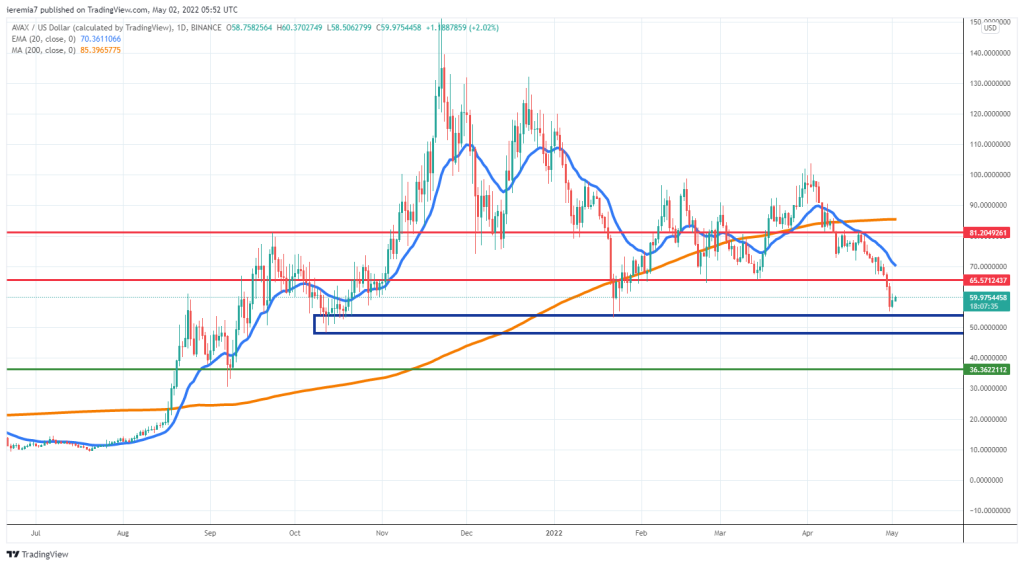
Avalanche is down 15% over the past week and we can see the selloff has been accelerating, driving the price closer to a key support area located around $50. The fact we see so many red daily candles is not encouraging and a deterioration in broad market sentiment can act as a tailwind for AVAX sellers.
We want to see whether the blue area highlighted on the chart can balance the order flow and maybe incentivize buyers to step in at a robust pace. If that will be the case, a pullback towards $65 and the daily 20 EMA is on the cards.
Failure to do that and a breakout below the key support will mean AVAX still has room for weakness. The $35 is another support to watch, considering it’s a swing point from September 2021. Like most of the other major altcoins, this one is also heavily in negative territory for the year, something that does not help optimism at all.


There are no comments at the moment, do you want to add one?
Write a comment