BTCUSD (Coinbase)
Source: TradingView
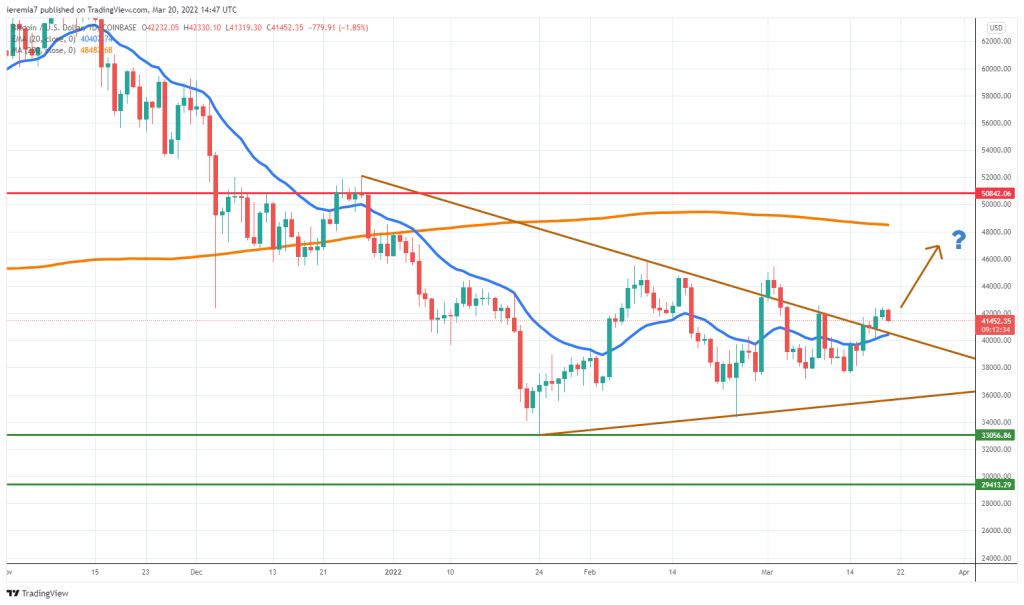
Since last week, Bitcoin’s price action developments have improved in favor of buyers, considering we see it above the triangle structure. Tech stocks banked four consecutive days of gains, so even if crypto as a whole lagged, next week we might see an extension on the upside.
This is not the first time the BTC price breaks above the triangle, so if there won’t be a swift break back inside the structure, that’s a bullish sign. If the move extends higher, the first major resistance to look at is $48,000, where the daily 200 SMA is located.
Now, it’s not a line in the sand, which is why traders should expect a brief break above it. $50,000 is another level, with psychological influence, to watch. Overall, selling pressure has moderated.
Headlines related to Ukraine can still weigh on markets. If selling pressure resumes, it’s possible to see BTC heading towards $36,000. Breaking below the triangle would be a major warning sign and the price could fall as low as $30,000.
ETHUSD (Kraken)
Source: TradingView
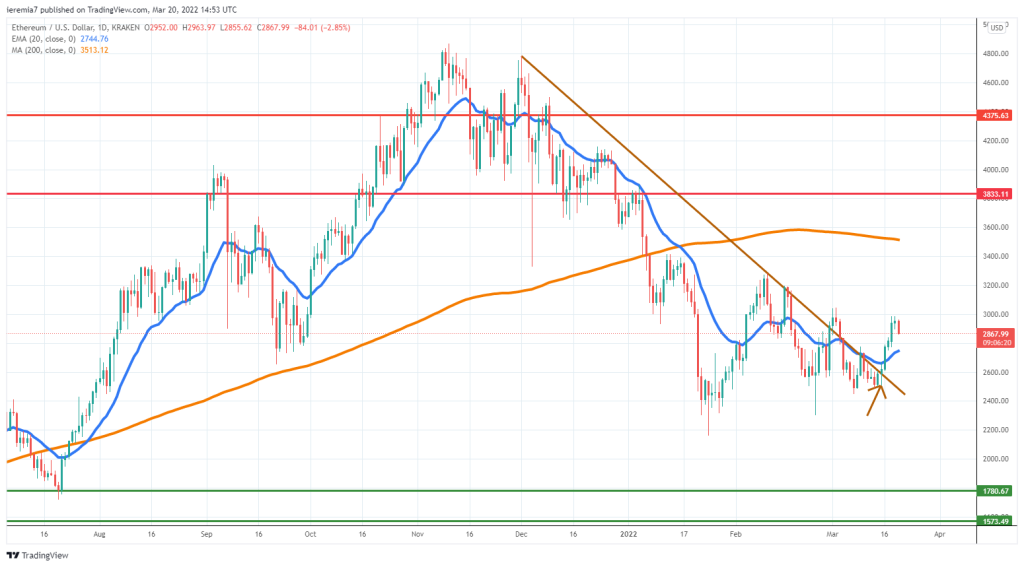
We can see 6 consecutive days of gains in ETH, and even though the Sunday candle is now red, the overall weekly performance is quite impressive. Market participants have been interested in this token because there was news on the Ethereum blockchain updates.
It will mean a major competitive advantage for the project so buyers are trying to front-run potential benefits. From a technical point of view, the price broke above a trend line going back to November 2021.
Fundamentals and technicals are aligned in favor of buyers, so we expect Ether to continue up next week. Same as in the case of Bitcoin, traders should watch whether the price can reach and break above the daily 200 SMA. That will be a confirmation the market is back in bullish territory.
A strong selling resurgence will be necessary to wipe out the improvements seen during this week. That would mean the price needs to break below the daily 20 EMA and also below the trend line. Both seem less likely because buyers would view pullbacks as opportunities to get long.
AVAXUSD (Coinbase)
Source: TradingView
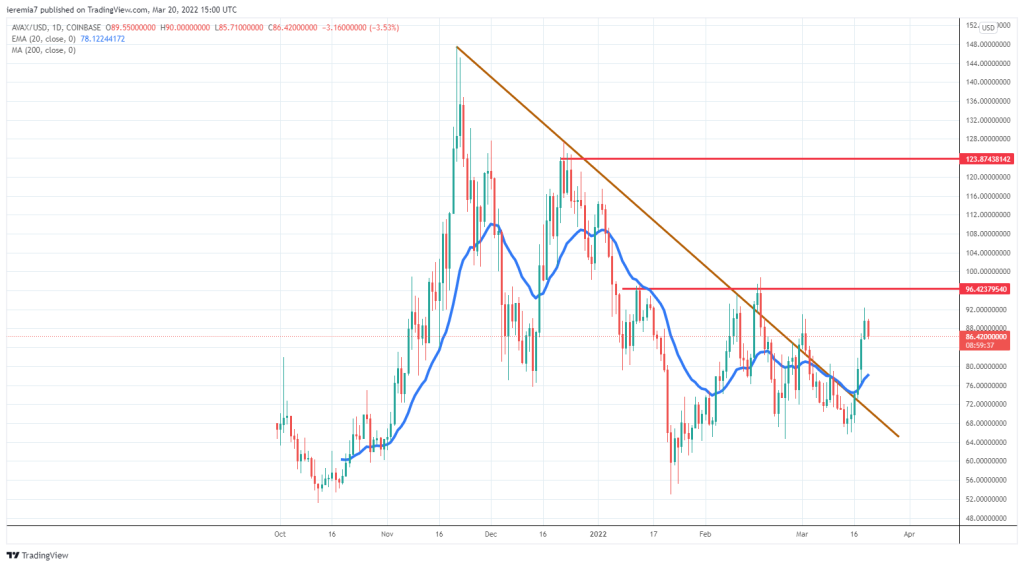
One of the biggest Ethereum rivals is up more than 20% over the past week, showing there has been an improvement in sentiment across the board. This token has been very volatile since November last year, but judging by how the price performance for the last few weeks, it seems buyers are absorbing selling pressure and are due for a larger bounce.
Once again, a broken trend line is suggesting the market is no longer in a bearish condition, so from now on, corrective moves can be opportunities to rejoin the trend.
Bids are expected around $80 and a break below that could then expose $70. These are psychological levels, but also where the daily 20 EMA, and broken trend line, respectively, are located.
On the upside, buyers could encounter resistance around $96. We see two major rejections off that area, so at least some profit-taking might take place there. A strong break above, however, will confirm the improving bullish sentiment. Past $100, AVAX can move towards $120-$125.


There are no comments at the moment, do you want to add one?
Write a comment