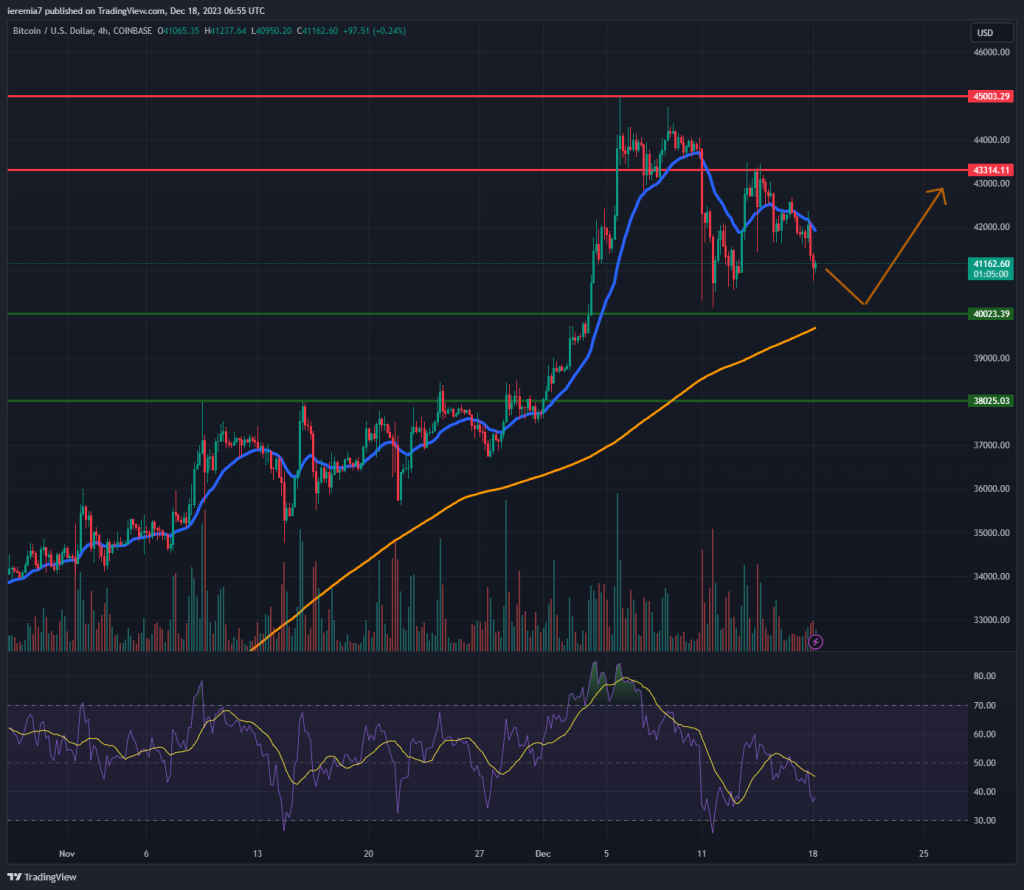
BTCUSD (Coinbase)
Source: TradingView
The market is gearing up towards the final two weeks of 2023 in a consolidative mode. Bitcoin came close to retesting the $40,000 key level and found support. However, it wasn’t the start of a new leg up as the upside was capped around $43,000.
Given BTC is up substantially for the year, we expect a muted market this week. Although seasonality continues to favor buyers, year-end profit-taking could balance the order flow. Hence, at least until a break happens, we expect Bitcoin to consolidate between $40,000 and $43,000.
On the downside, the level is backed by the 4h chart 200 SMA and the fact that the RSI already retraced from overbought conditions. In case the market breaks above $43,000, buyers should watch $45,000 as a new major resistance. With risk appetite so elevated it’s hard to bring down this market, so you shouldn’t expect a major correction lower at least until mid-January, based on our current assessment.
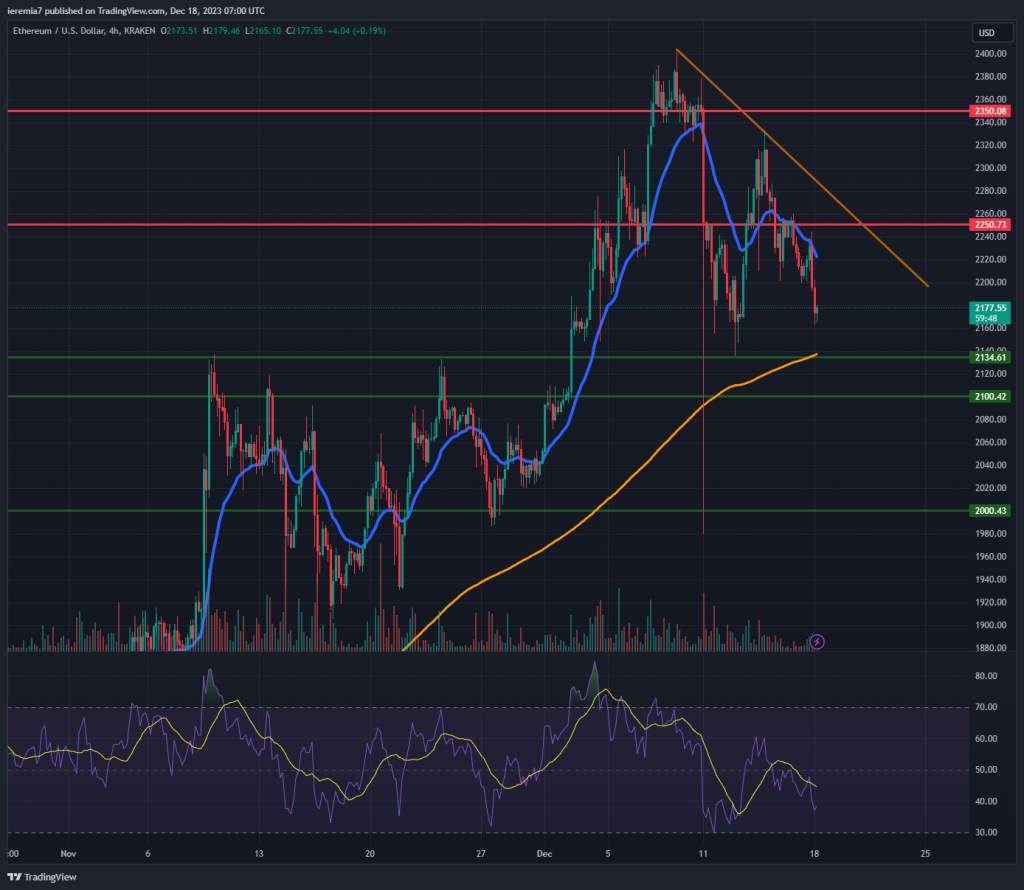
ETHUSD (Kraken)
Source: TradingView
Ether is in a similar condition after a brief flash crash on December 11th. The market has been volatile since that day, suggesting the selling pressure was short-lived. The price trades below the 20 EMA on the 4h chart, treating the blue line as resistance.
That’s a subtle sign of weakness, as long as it persists. However, the downside is limited, given we expect support to emerge around $2,130 – 2,100. That area should be able to cap selling and maybe a new push higher can start there. Further selling below would open more room towards $2,000, which is another major support level.
If ETH manages to break back above the 20 EMA and treat it as support, instead of resistance, that will be a confirmation for the resumption of bullish flows. Traders need to be careful because as our chart shows, there is a short-term bearish trend line that the market seems to respect so far.
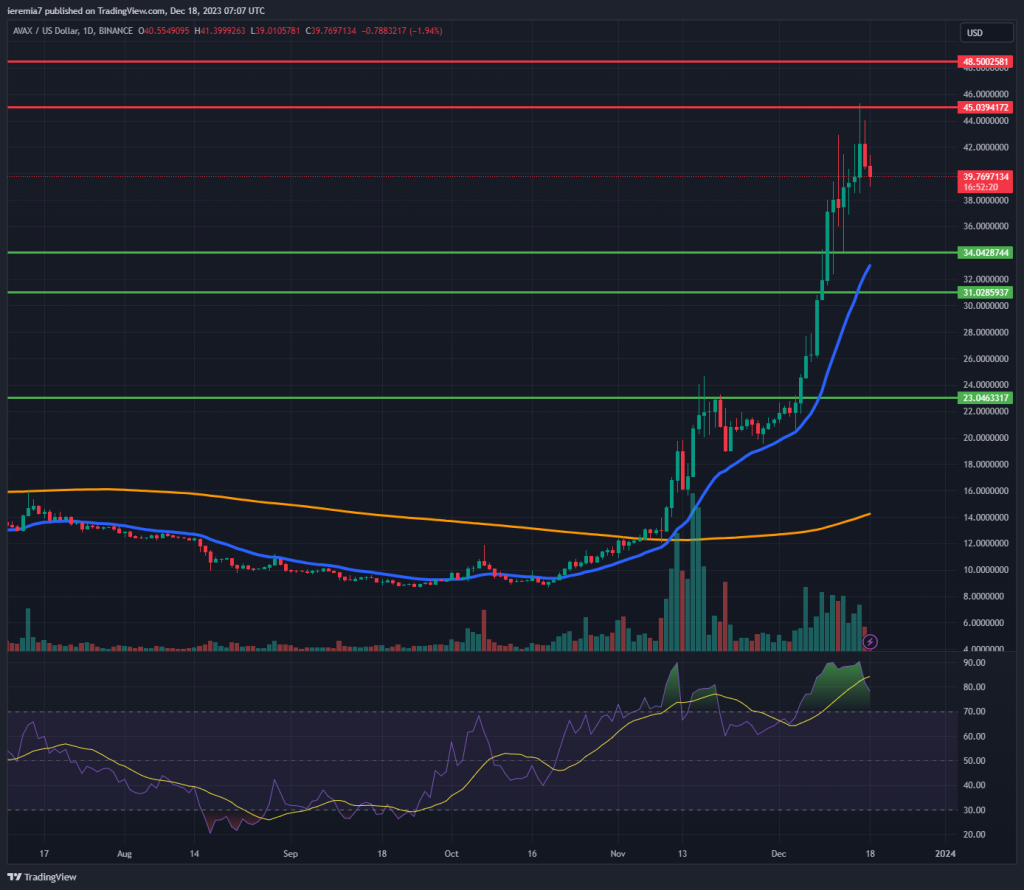
AVAXUSD (Binance)
Source: TradingView
When Bitcoin is up and volatility compresses, traders and investors shift their attention to other altcoins. Last week one of the most favored names was Avalanche, given its price continued to surge more than 10% in 7 days.
The daily chart of this coin is pretty clear, suggesting there is a major order flow imbalance in favor of buyers. Still, that doesn’t mean you don’t have to watch carefully how the price reacts to key levels. As our chart shows, the upside was capped around $45, which also happens to be a major inflection point from the past.
Additionally, the pullback was favored by the extreme overbought conditions signaled by the RSI. If we see AVAX continue to weaken, the first line of support comes at $34. We anticipate buyers will kick back in once the price touches the daily 20 EMA, as it already happened in the past. If not, look for support below at $31.
In the bigger picture, buyers continue to be the ones favored. If sentiment starts to improve again, watch to see if $45 fails to cap the buying. The next resistance levels to watch are $48 and then $50.


There are no comments at the moment, do you want to add one?
Write a comment