
BTCUSD (Coinbase)
Source: TradingView
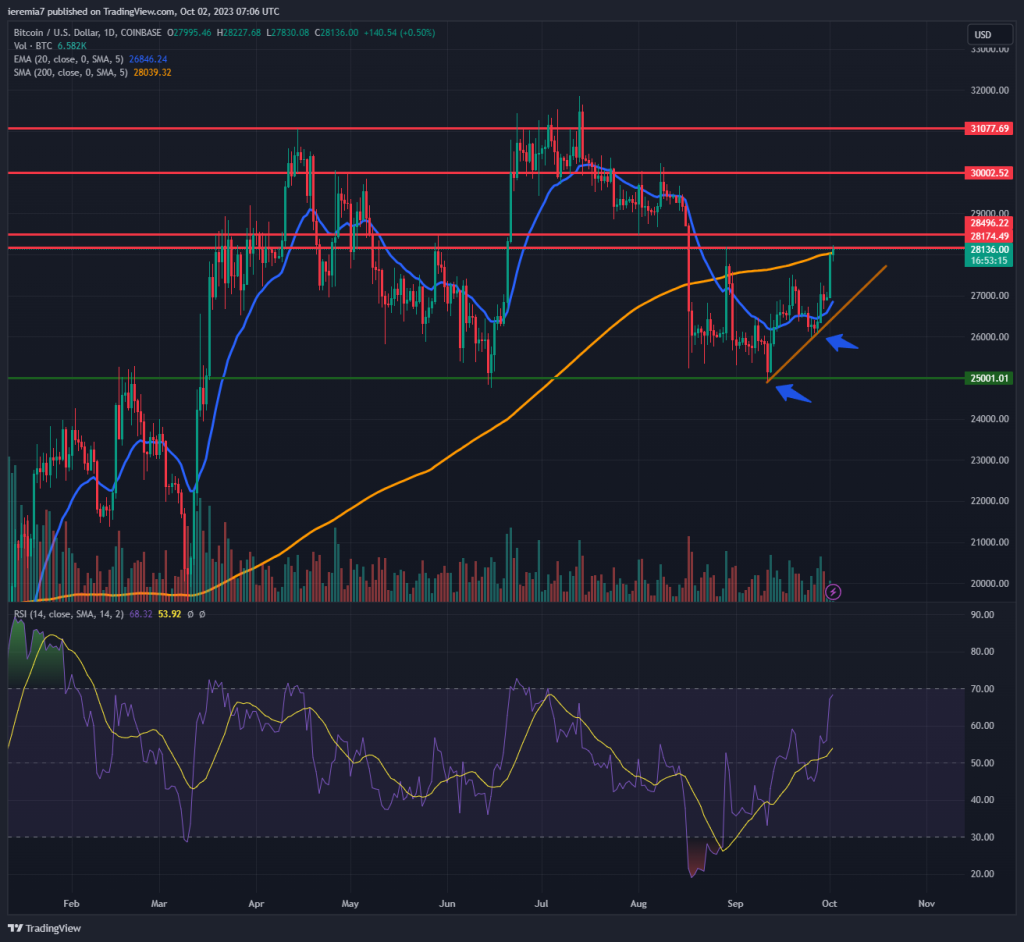
Bitcoin moved up last week, reaching $28,100, a key resistance level highlighted in the past. Sentiment has improved and now we believe there’s a greater probability for a retest of $30,000, given this is the best seasonal period of the year for crypto.
Pullbacks shouldn’t be ruled out, which is why we advise traders to see how the price reacts around the daily 20 EMA and the short-term ascending trend line drawn on our chart. That would be a better place for longs since conditions won’t be overbought.
Once BTC clears the 200 SMA, there’s no major line of resistance until $30k. If the market overshoots, $31k and $32k are places where bulls might take some profits. Despite favorable conditions, you shouldn’t get complacent.
After all, Bitcoin continues to trade around the 200 SMA after weeks in a row it failed to bounce above it. Although we suspect bearish moves to be short-lived, one shouldn’t rule out such a scenario. The bullish setup fails if the market breaks below the trend line. That could be an early signal suggesting BTC can retest $25k once again.
ETHUSD (Kraken)
Source: TradingView
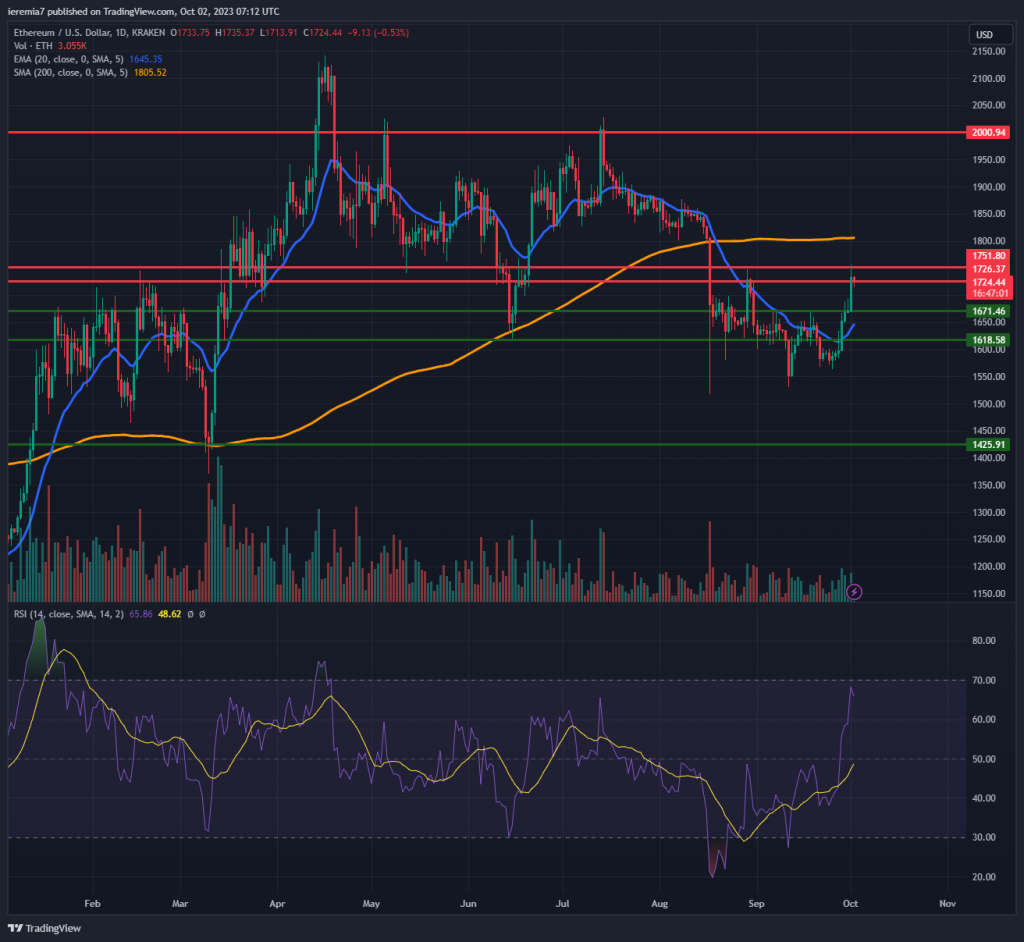
Ether rose 7 days in a row, showing buyers resumed in strength. In such conditions, traders want to buy on pullbacks, targeting moves in the direction of the dominant trend. It might be the case that the market is front-running the launch of an ETF based on ETH futures contracts. The event could take place this month and might lead to new flows into the second-largest crypto.
As a result, we favor the upside and expect the price to continue up. The $1,725- $1,750 seems like a short-term resistance area, but once the buyers clear it, the 200 SMA at $1,800 will follow next. The ability to break and close above it will be another bullish development and in that case, we favor a continuation towards $2,000.
Bearish pullbacks should be shallow, but $1,670 and $1,620 look like decent places for buyers to resume strongly. Only a plunge below $1,550 will negate our current view.
TRXUSD (Bitfinex)
Source: TradingView
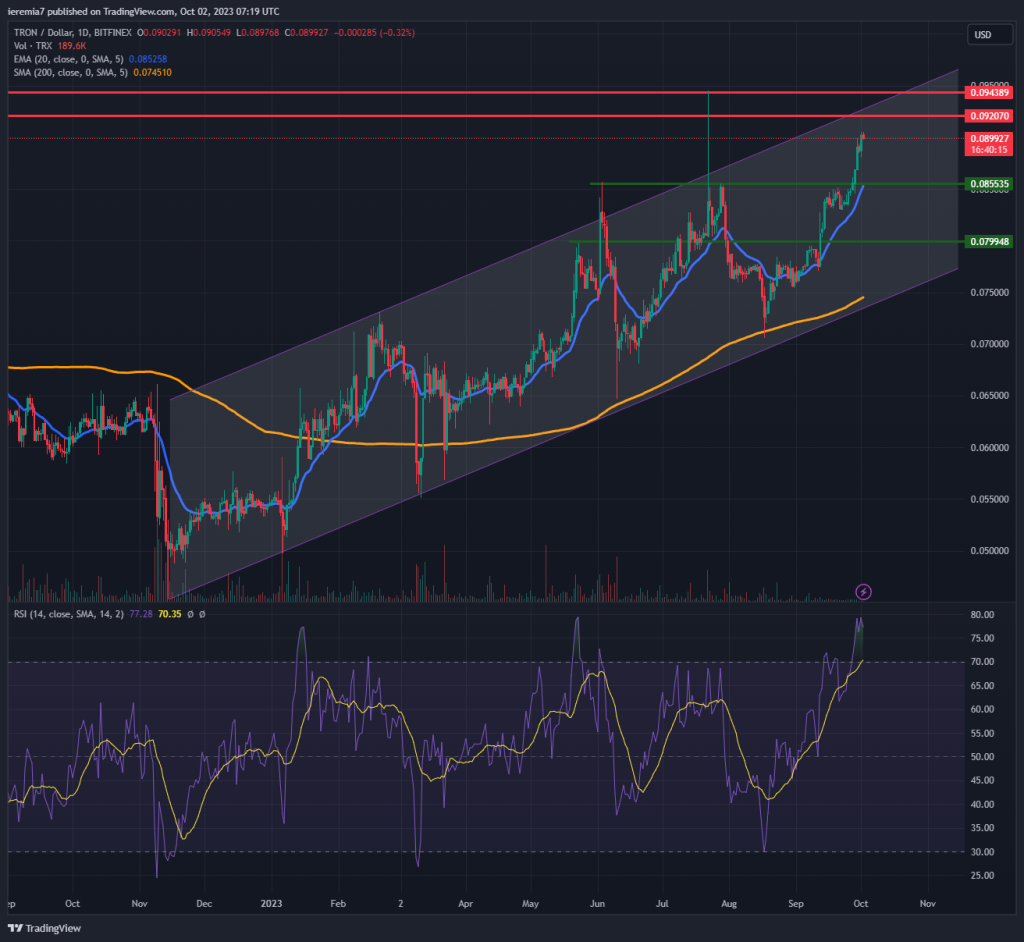
Tron rose 100% since November 2022 and as the price action shows, this coin moved up nicely inside a bullish channel formation. The structure continues to be in play and we believe there could be room for some added gains.
However, since this is an outperformer and now other beaten-down cryptos are starting to rebound, the market could reduce exposure and redeploy capital. Additionally, the area around 92-94 cents is a key resistance where selling pressure could intensify. That’s also where the upper line of the channel overlaps.
If the resistance zone holds, TRX will be poised for a lower pullback. The first target for such a move would be 85 cents. Stronger selling pressure might lower the price, but we expect strong support around 80 cents and then the daily 200 SMA.
Keep in mind that although the bullish trend is still intact and could extend higher, you need to watch for changes in the price action structure suggesting sellers are getting stronger. At some point, buyers run out of power and traders get caught with their bids at high levels.


There are no comments at the moment, do you want to add one?
Write a comment