
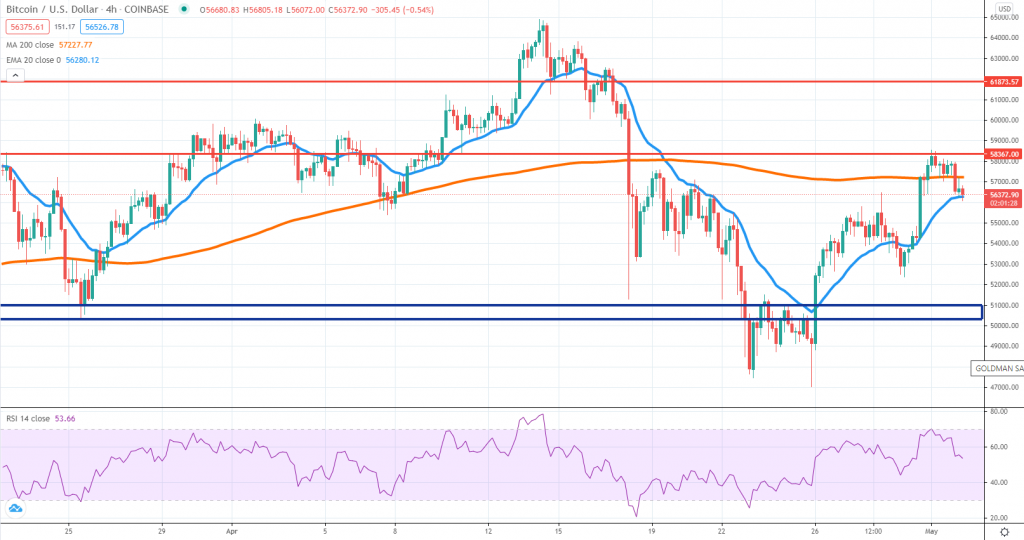
BTCUSD (Coinbase)
Source: TradingView
A week ago we did not exclude a potential rebound in the BTC price and as it can be seen from the chart, that’s exactly what happened. The buyers took short-term control over the order flow but failed to break around our first major resistance zone located around $58,300. That’s also where the 4h chart 200 SMA is located and it should be no surprise to see selling interest emerging.
We’re at the beginning of May, a month with a poorer seasonality for Bitcoin, which is why we suspect the sellers will continue to pressure the price lower over the upcoming weeks. Failure to generate new higher highs in the new week will mean the price can dip towards the $50,000 area once again.
A breakout above the first red line on the chart can open more room on the upside, with $60,000 and $62,000 as the next resistance levels to watch. The RSI had already started to point south and that’s not helping the short-term momentum.
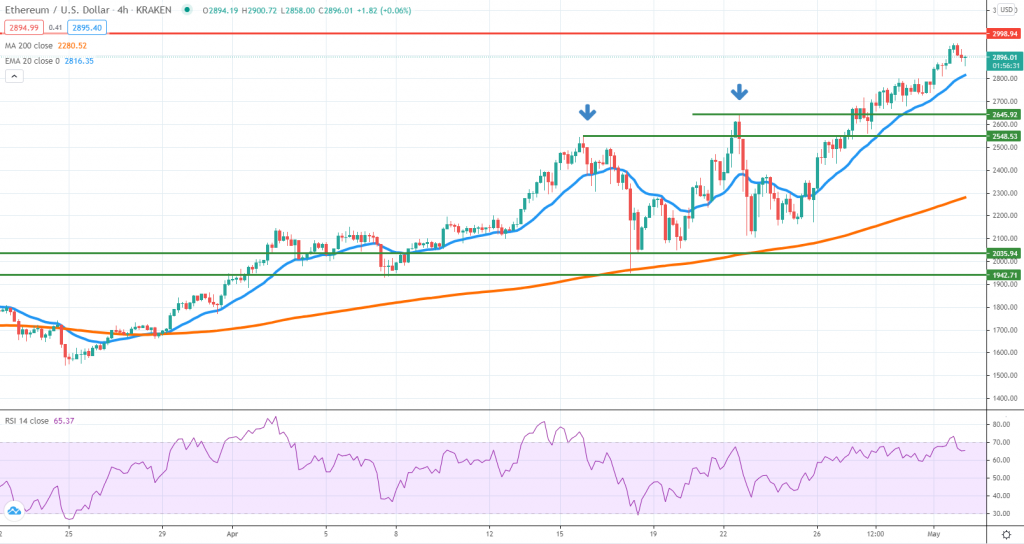
ETHUSD (Kraken)
Source: TradingView
The Ether picture is completely different as the second-largest token in the world diverged from the Bitcoin performance and pushed to new all-time highs. At the time of writing, the price is trading around $2,900 and reaching $3,000 for the first time in history shouldn’t be excluded in the near term.
For the time being, there is no sign suggesting a shift towards the sell-side occurred. Dips are mild, the price is floating above the 4h chart 20 EMA and buyers resume in force each time there is a pullback. In case selling will intensify, buyers looking to rejoin the trend should look at $2,600 and $2,500. A longer corrective move towards the 200 SMA can follow if those won’t hold.
On the upside, we advise caution as ETH gets close to $3,000. On top of the extreme overbought conditions on higher time frames, that’s also a major psychological area where market participants could be trimming their long exposure.
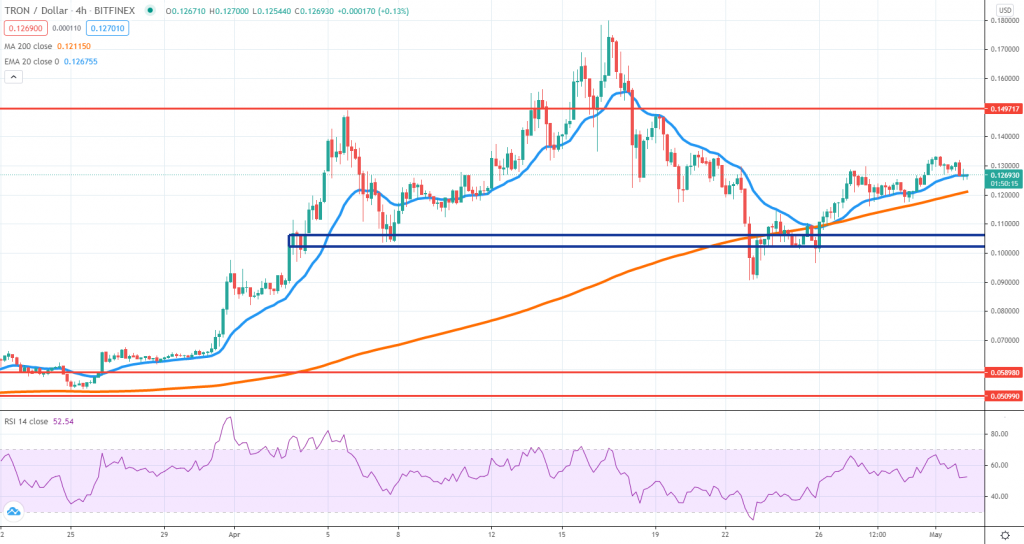
TRXUSD (Bitfinex)
Source: TradingView
Tron is showing weak buying momentum after the slump and on top of that, the bigger picture is suggesting a head-and-shoulders pattern might be unfolding. The top of the left shoulder is located around 15 cents which is where sellers can find the optimal entry to short the market.
Right now the price is mildly edging higher, trading above both the 4h chart 20 EMA and 200 SMA. Those should act as support in case of minor pullbacks. If the price gets to 15 cents and sellers show signs of strength, that a major early warning for TRX, as the price could take a major dive lower.
Buyers need to break above 15 cents and pressure the price towards the 18 cents, where the current 2021 high is located. Only if that will be the case, should we talk about an increase in probabilities for a continuation higher. The current pullback higher is not encouraging enough to support more aggressive buying and that is why the market is in a wait-and-see mode.


There are no comments at the moment, do you want to add one?
Write a comment