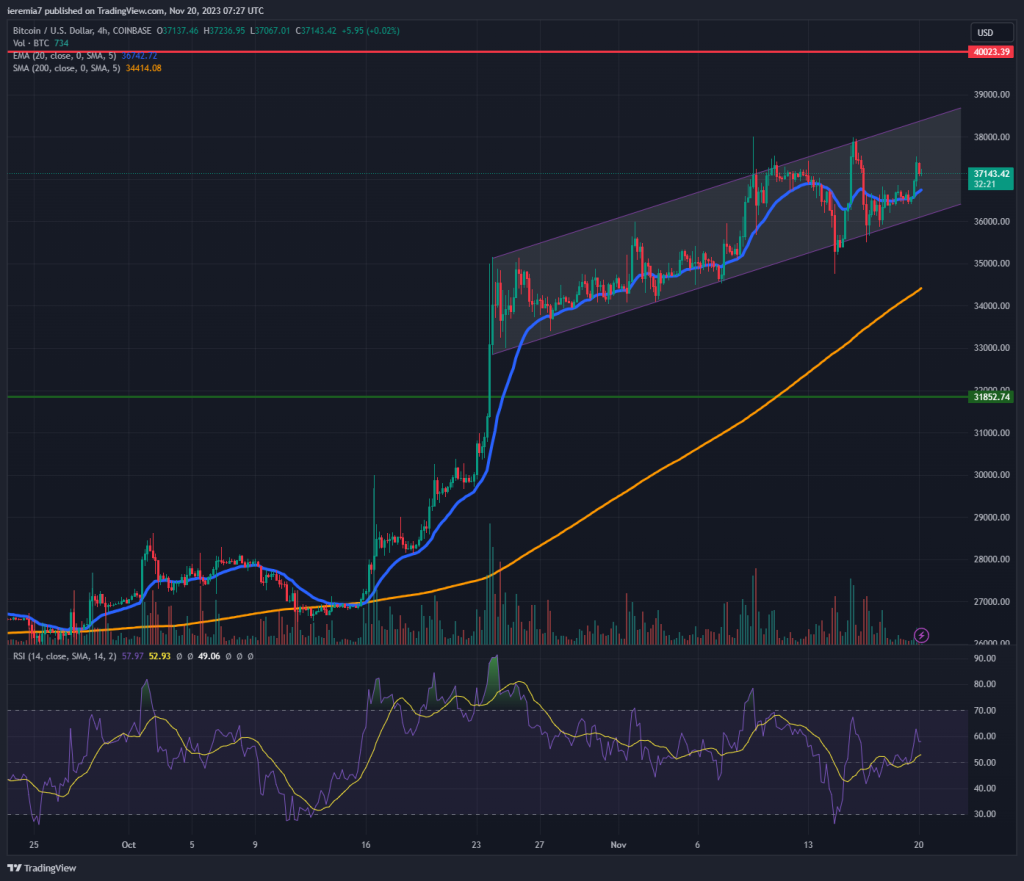
BTCUSD (Coinbase)
Source: TradingView
Although momentum slowed, Bitcoin continues to be in an uptrend. Buyers are eager to buy each dip, which leaves most of the recent gains intact. We can see on the 4h chart how the price fluctuates inside a short-term ascending channel.
As long as the structure remains in place, we favor a continuation towards the major resistance zone around $40,000. Traders should carefully watch for subtle changes in the price action, in particular, whether the market breaks below and starts treating as resistance the 20 EMA. The RSI also remains in neutral territory around 55, so both buyers and sellers have room to take advantage of.
If we start to see weakness and the price breaks below the channel, traders should focus on the 4h chart 200 SMA first. Below that, the most important support zone is located around $31,800. That’s a prior high and a role reversal level. The market treated it as resistance in the past and now that we’ve breached above it impulsively, bids are expected to accumulate there.
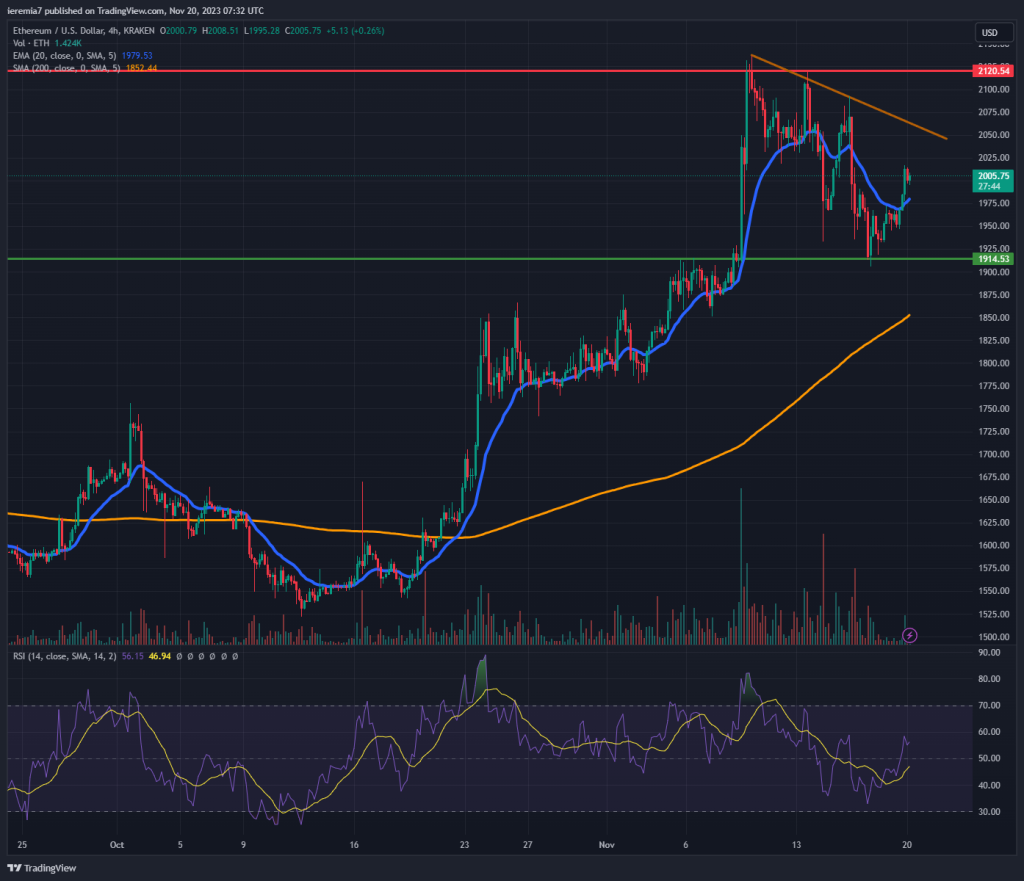
ETHUSD (Kraken)
Source: TradingView
In the case of Ether, there seems to be greater weakness. News about an ETF based on this coin did not spur a massive wave of buying and now the market consolidates around $2,000. The broader picture suggests the price is currently locked inside a range between $1,900 and $2,120.
Both sides of the range rejected impulsively, which means sellers and buyers are willing to defend them. Compared to BTC, which is still grinding up, Ether made a high on November 10th and since then consolidated lower.
We can also see a short-term bearish trend line already confirmed by three points. In case the price moves up to $2,050 and then weakens, ETH may weaken towards $1,900 again. On the bright side of things, although consolidating, the volatility is higher, which creates plenty of opportunities for short-term traders.
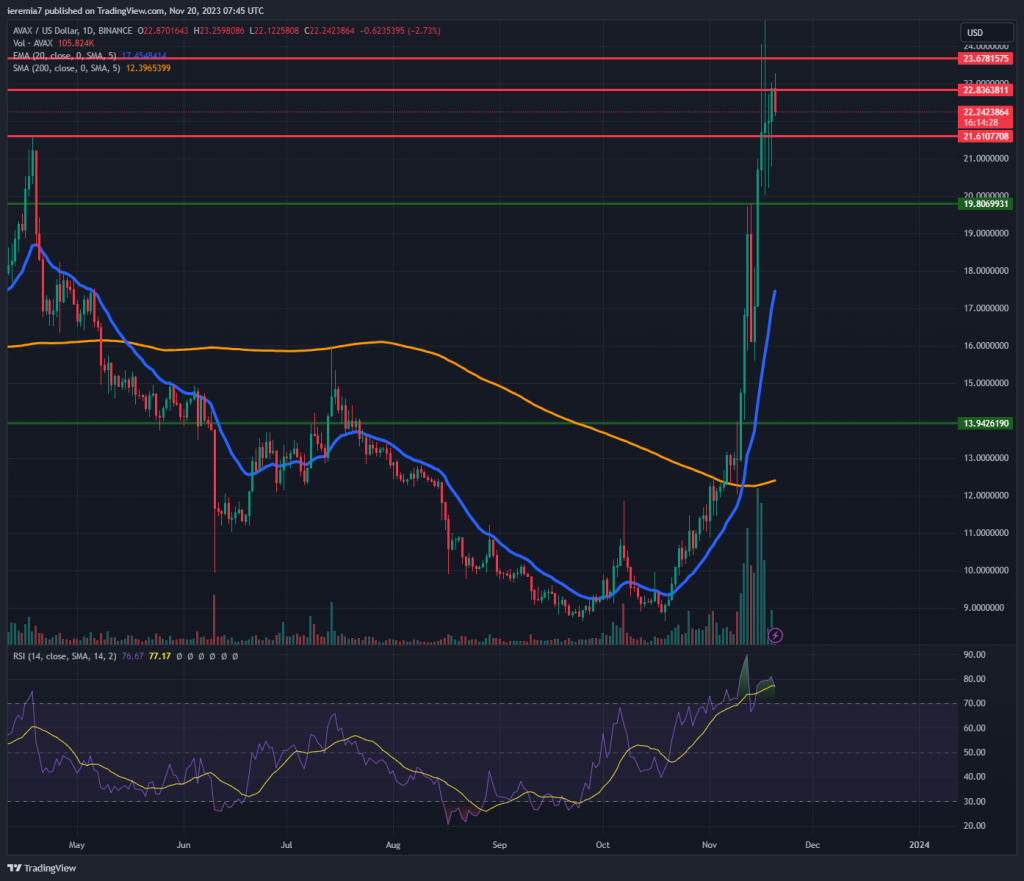
AVAXUSD (Binance)
Source: TradingView
While volatility compressed in major coins, altcoins are now seen outperforming. An important name up over 20% last week is Avalanche. We can see how the price surged into the major resistance levels highlighted on our chart and how sellers seem to gradually balance the order flow.
We view $22.8 and $23.7 as key update resistance levels and as long as the price stays below them, AVAX could continue to consolidate. Those are prior highs seen during Q1 2023 and as the market was capped then, sellers seem to emerge once again.
In the longer run, it looks like AVAX has bottom and has a clear path ahead towards $30. However, in the short term, traders shouldn’t rule out a consolidation phase. The price is trading far from the daily 20 EMA and the daily RSI is at 77, suggesting overbought conditions. Traders could either look for shorts off the resistance levels mentioned above, or they can wait until AVAX weakens further.
One of the notable support levels is $19,80, close to the $20 psychological area. Those wanting to gain exposure to Avalanche might be able to find a better entry there.


There are no comments at the moment, do you want to add one?
Write a comment