
BTCUSD (Coinbase)

Source: TradingView
Bitcoin has been consolidating in a narrow range after the slump. This suggests market participants are waiting on the sidelines for further clues. As you can easily notice from the chart, the price is gravitating above and below $26,000.
At this point, the bears are still in control. On the 4h chart, the RSI already bounced from extreme oversold conditions, which gives room for a new push to the downside. We expect the market to head towards $25,200 and $24,900. Those two levels form a decent support area. Strong selling below them will expose $24,000.
On the flip side, if Bitcoin bounces above $26,000, the first level to watch is $26,600. Stronger bullish interest will suggest the coin could continue to recover some of the losses. The $28,000 area is the first major resistance to watch. Also, don’t ignore the 200 SMA, given the market treated it as resistance during the last couple of weeks. All in all, even if selling has stopped, the bottoming phase might take a while to complete.
ETHUSD (Kraken)
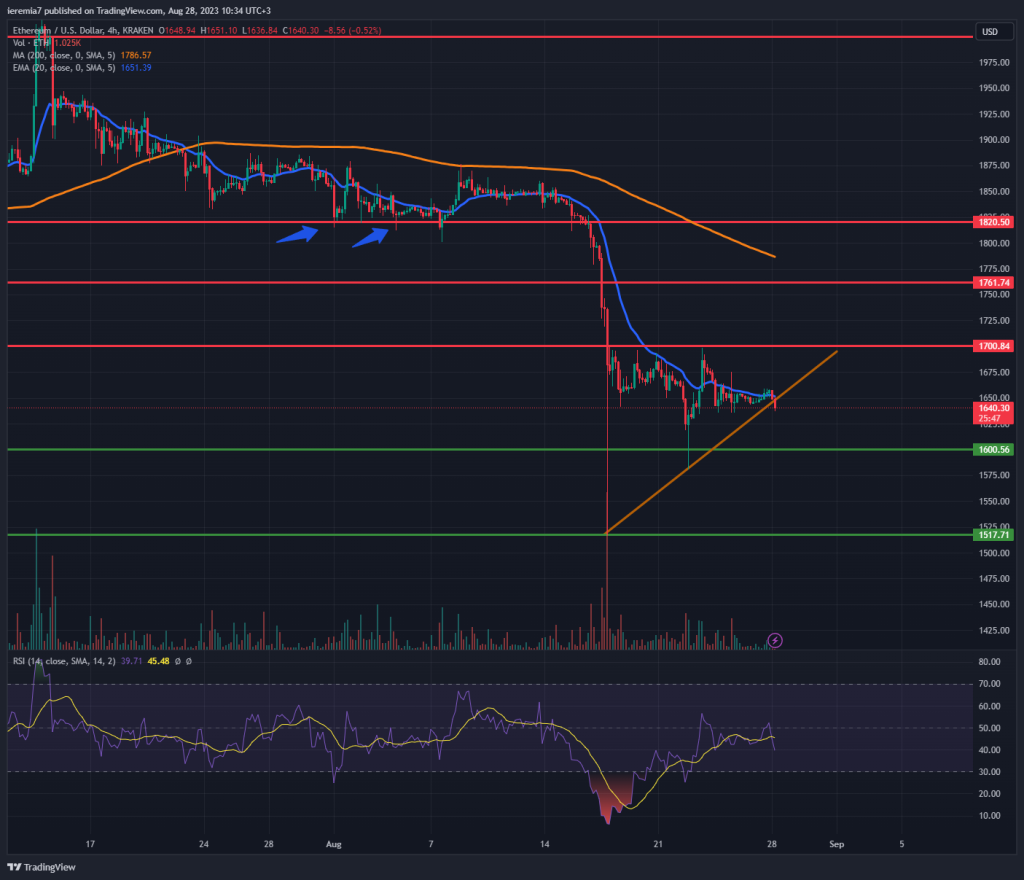
Source: TradingView
The correlation with Bitcoin remains high and that’s confirmed by the same consolidative stance. However, Ether is trading a bit higher from the lows reached on August 17th. Still, the market reacts by selling around the 4h chart 20 EMA.
The sentiment remains bearish until the price breaks above and treats it as support. In this scenario, the short-term ascending trend line that has recently been touched is the first support to watch. Below it, we expect bids around $1,600 and $1,520.
It’s challenging to decide on the direction of the next move at this stage. However, short-term traders can find opportunities by monitoring our key levels of support and resistance.
If Ether does recover, sellers could resume around $1,700. Breaking above that will suggest buyers are more confident and their next challenge will be to clear out the sellers waiting at the 200 SMA. The period starting in October is positive for crypto from a seasonal point of view.
TONUSD (TradingView)
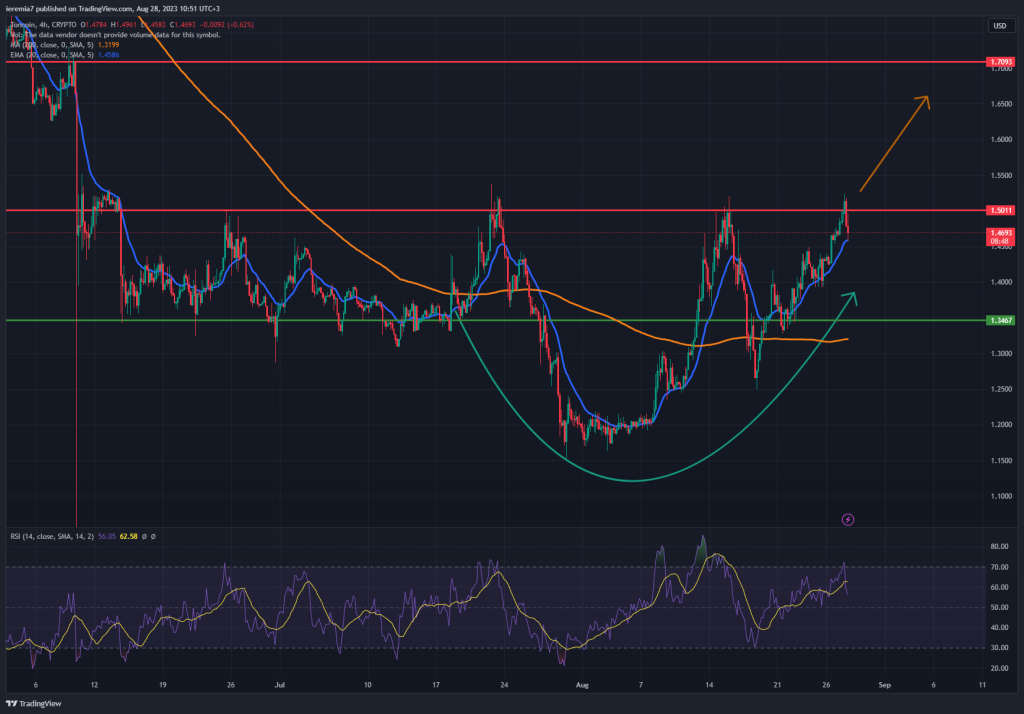
Source: TradingView
In this sea of red, few cryptos manage to post positive returns. Toncoin posted 7% gains last week and when looking at its chart, favorable developments might follow. We can see the nice parabolic structure and how buyers were confident to buy the dip towards the 4h chart 200 SMA.
The key level to overcome is $1.5. As you can see, there are multiple rejections off that level, suggesting elevated selling pressure. However, sellers seem to be squeezed by buyers and we expect a breakout on the upside as our best-case scenario. If that happens, TON could continue to rise towards $1.7.
One should not ignore the bearish setup. Thus far the market has treated the 20 EMA as support. Strong selling could mean the price might retrace towards $1.35. That’s a key role reversal level and a place where we expect buyers to resume stronger. Compared to BTC and ETH, this coin is much better positioned for an upside breakout.


There are no comments at the moment, do you want to add one?
Write a comment