BTCUSD (Bitstamp)
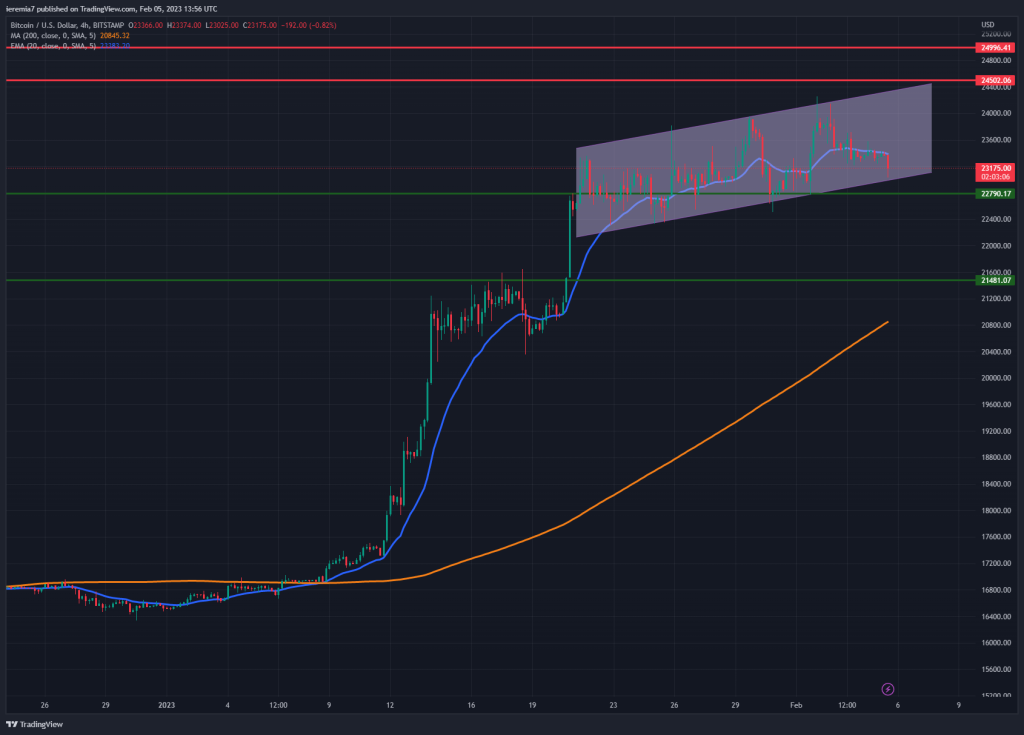
Bitcoin’s bullish sentiment continued to moderate during last week. As can be noticed from the chart, each time the price sets a new weekly high, sellers step in and wipe out all gains. Thus far the price action is contained inside an ascending channel, but a break on either side could spark volatility again.
Because the start of the year delivered unexpected gains, we stick to our expectations for a corrective move lower. For that to happen, traders need to see a breakout below the channel. Important support areas to note are $22,800, $21,400 and then the 4h chart 200 SMA. Also, if the 20 EMA starts to be treated as an overhead resistance, it will be another sign confirming the bearish tilt.
As long as the channel holds, it’s possible to see Bitcoin rotating higher again. Resistance is expected near the $24,500 – $25,000 key area. We suspect stronger sellers will emerge around it, so it’s better to wait and see how the price develops, once it reaches that zone.
ETHUSD (Kraken)
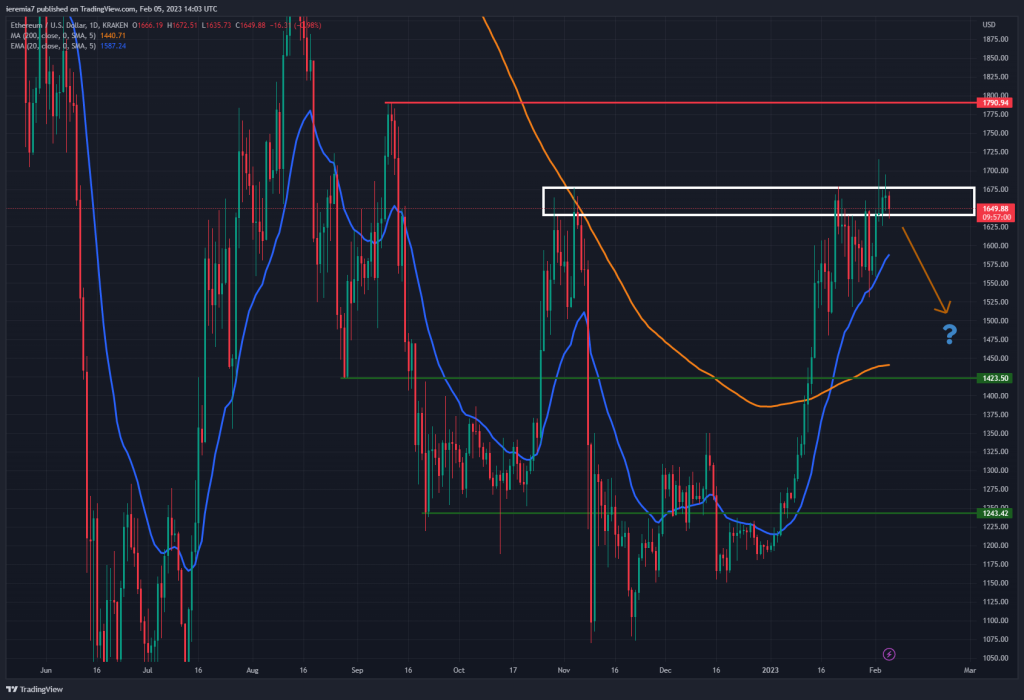
A similar scenario could be seen with Ether, where the upside is being capped by a prior key resistance zone. More specifically, the price is showing signs of weakness where it did the same in November 2022. At that time, ETH tumbled over 25% in less than 5 days setting up new lows for the year.
We believe there is scope for more weakness as long as Ether continues to trade inside/below the highlighted white area on the chart. On a breakout above it, $1,800 looks like the next likely upside target.
In case weakness does materialize next week, traders need to watch the daily 20 EMA for short-term support. If that doesn’t happen, it’s possible the token needs to weaken further before finding strong buyers. You should watch for bullish activity around the 200 SMA and then $1,250 if the selling gains momentum.
FTMUSD (Binance)
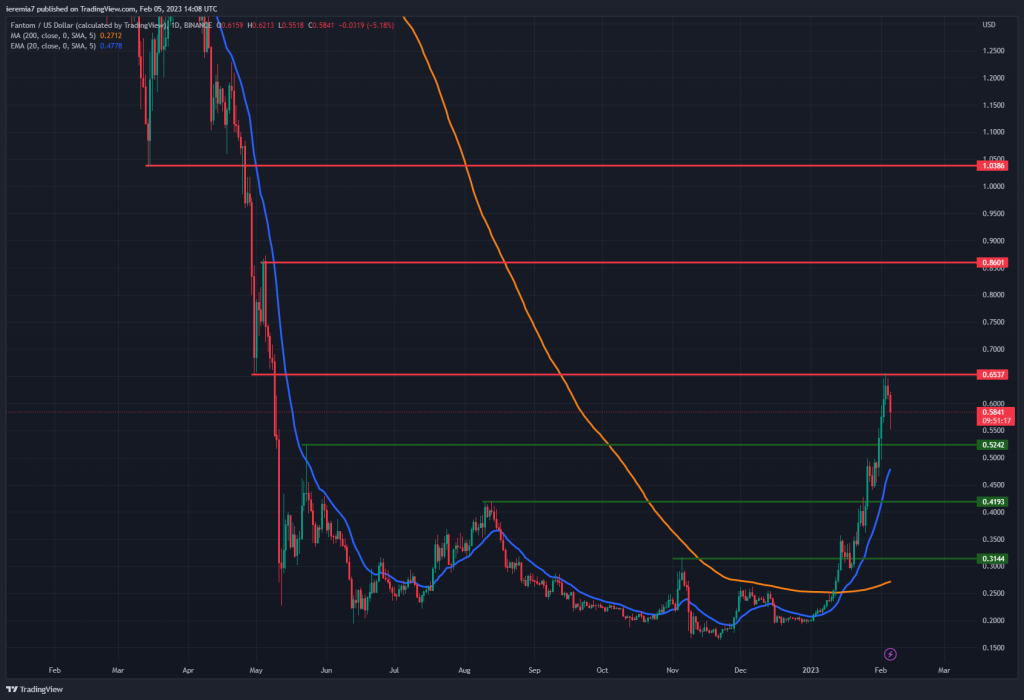
While large tokens are struggling to push higher, traders are forced to look at smaller altcoins in their quest for price directional bias. It is the case with Fantom, a cryptocurrency posting +20% gains for the week.
The daily chart is pretty conclusive, showing FTM managed to rise from 20 cents to 64 cents during January 2023 alone. With the bottoming formation completed, traders should now look for upside targets and places where bearish pullback could end.
Two days ago the rally stalled around 65 cents, which is where a May 2022 swing low can be spotted on the chart. Breaking above that level opens more upside potential towards 86 cents and then $1.
You should not ignore the scenario in which FTM takes an impulsive turn lower. If that happens, support is expected around 52 cents, the daily 20 EMA and 42 cents. The price action context continues to favor bulls, though and it will take a dramatic change in structure to suggest the bearish trend resumed. This coin is pumped by the market and this is not the time to fight the bulls.


There are no comments at the moment, do you want to add one?
Write a comment