
BTCUSD Coinbase
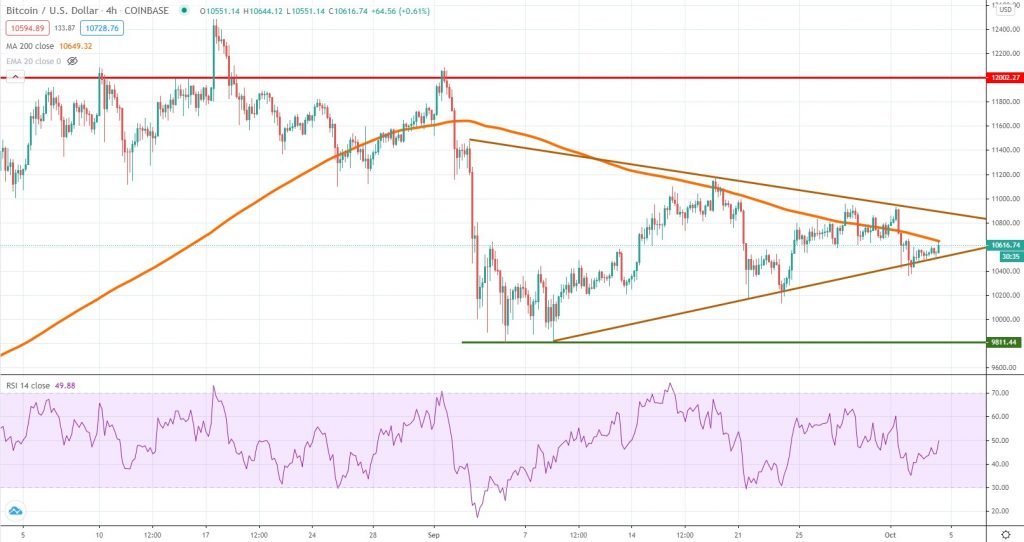
Bitcoin volatility continues to compress as does its price, currently trading inside a triangle formation. Given the high degree of uncertainty during the past few weeks, it is hard to anticipate the direction of the breakout, which means traders should play the structure until that happens.
Support had emerged again on October 2nd, right around the lower line of the triangle and now we expect the price to head towards the $10,800 area. The structure gets narrower, raising the odds of a breakout during the next week.
In case the breakout will occur on the upside, we suspect Bitcoin will continue to recover the September losses and head again towards the key $12,000 resistance zone. If the break takes on the downside, it would be good for sellers since that will mean the key support around $10,000 – $9,800 will be revisited. That will also broaden the scope for more weakness in the weeks ahead.
ETHUSD Kraken
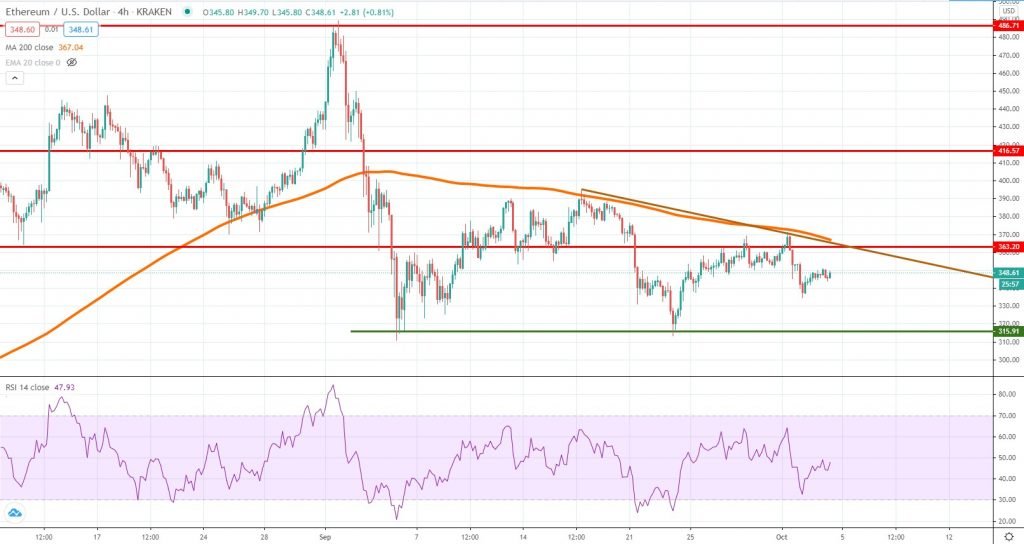
The picture looks more bearish for Ether, which seems to be trapped inside a descending triangle. From an order flow perspective, this communicates the bears are squeezing the bulls towards a key support, which in our case is located around the $315 area.
At the beginning of next week, we could see the price extending higher, but $363 and the 4h chart 200 MA could be a real challenge. Resistance had emerged strongly during the past few weeks and the same could happen again. An impulsive break above the MA would be a short-term bullish signal, but we still need to see follow-through after that.
If the resistance area will hold, then Ether weakness will prevail and $315 would be again in sight. Traders should brace for more volatility in the weeks ahead, as cryptocurrencies are very likely to be affected by multiple risk factors (US election, rising COVID-19 cases, Brexit, etc.)
TRXUSD Bitfinex
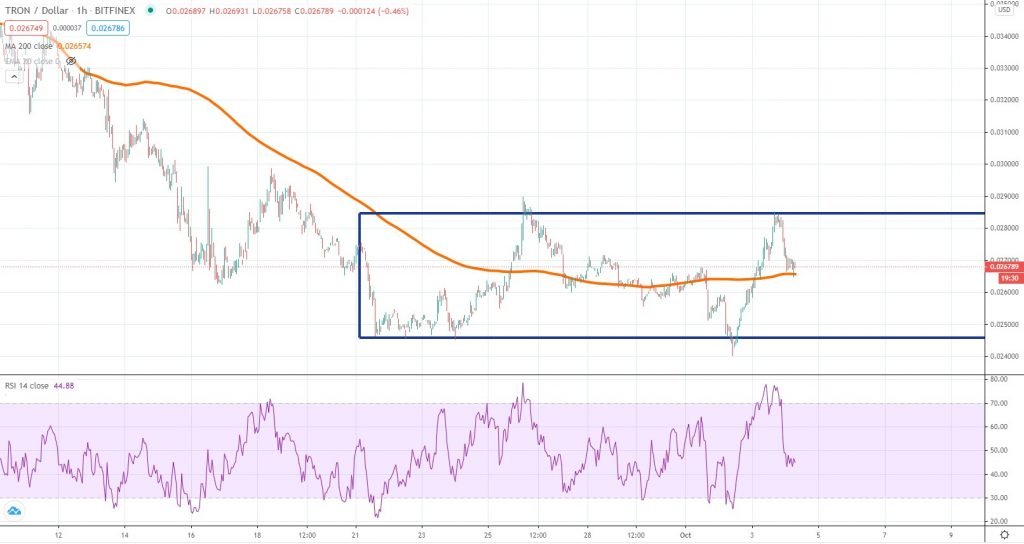
Tron had been range-bound since mid-September, a period during which the price had been locked between 2.4 cents and 2.8 cents. Even though nominally that seems to be a short range, in reality, it accounts for close to 20% of Tron’s value. There are several important aspects to consider about this structure, potentially communicating where the next breakout will occur.
Firstly, it is important to note that it happened following an impulsive bearish look. Secondly, we should look and the total number of touches on both sides of the range. There are 5 touches on the downside and only two on the upside, suggesting buyers had been struggling to turn the order flow the other way, while the sellers were very aggressive around 2.8 cents.
These two factors combined suggest there is a higher probability we could witness a continuation on the downside, with the next major support located around 2 cents. Keep in mind this isn’t a certainty and everything can happen in such a wild market, but as things stand today, we could see more pain for bulls, before Tron starts to recover.


There are no comments at the moment, do you want to add one?
Write a comment