
BTCUSD Coinbase
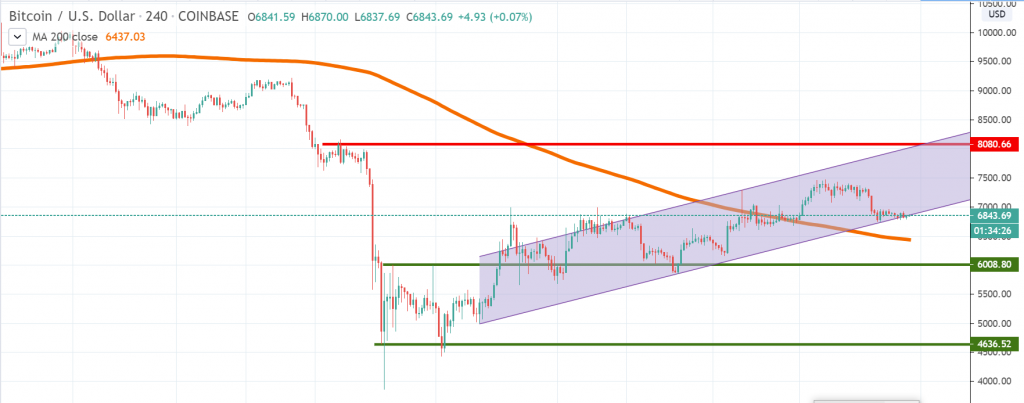
The month of April continues to see Bitcoin with lower volatility and with losses erased. After almost reaching the $7,500 area, the price weakened once again below $7,000, but despite of that, it is trading inside a bullish channel formation. Despite a choppier performance, Bitcoin is recovering and given the current stance, we believe it still has the potential to reach the $8,000 area.
A selloff is not excluded before that happens, but overall, our view on Bitcoin right now is bullish. A textbook parabolic structure continues to unfold and at some point in time, it could very impulsive on the upside. We should not forget that the halving is approaching and volatility should spike again.
In case a breakout below the channel will occur, the 4h chart 200 moving average should be monitored. Given the current price action picture, we believe the worse case scenario is Bitcoin weakening towards $6,000, before it starts to trend higher once again. Global risk assets had performed very well over the past three weeks and until that changes, Bitcoin should be favored, as well.
ETHUSD Kraken
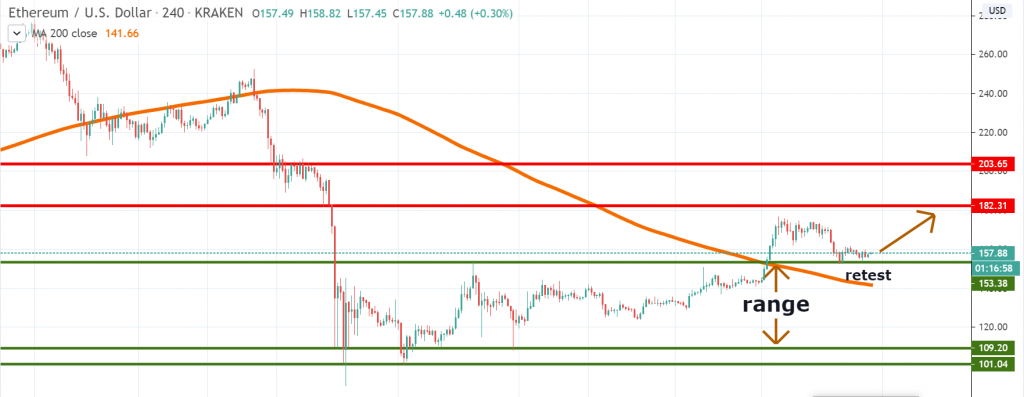
The Ether price had been showing positive signs during the past week, after breaking above the range we’ve mentioned in our last weekly crypto analysis. What’s even more encouraging for the bulls is that the price had retraced back to the broken area and for the past one day and a half it had been consolidating around it.
In the absence of an impulsive breakout lower, this is a typical breakout-retest trading opportunity which is expected to push Ether back above to prior April 7th highs. Given the overall price action structure, we believe we could see an even higher breakout and a retest of the $182 resistance area.
A breakout back inside the range, on the other hand, will show the bullish strength had weakened and the 4h chart 200 MA would be the first support on our list. Due to thin liquidity, a brief break inside the range won’t make a huge difference. Watch only for very aggressive selling moves.
XRPUSD Bitfinex
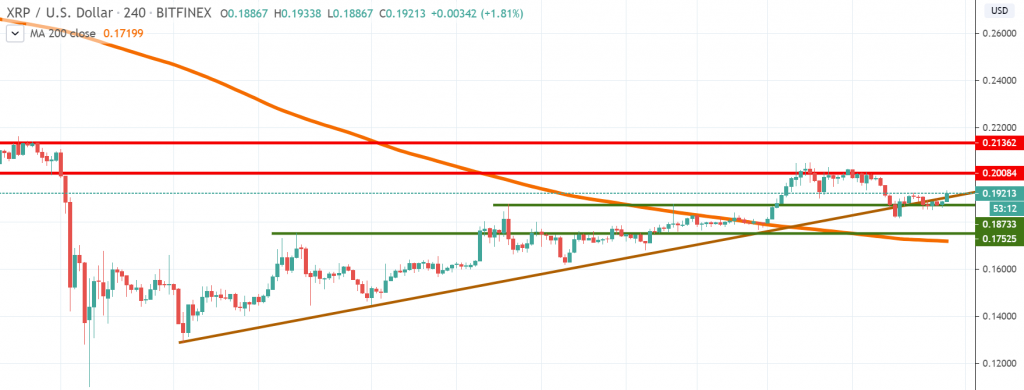
Since March 13th, XRP had started a bottoming process that continues to extend higher even at the time of writing. There had been three significant pullbacks along the way but each time the buyers had resumed and pushed the price above the prior short-term high. The same thing seems to be happening once again as we write our analysis, with the price moving towards the 20 cents resistance level.
Some resistance could be encountered around 20-21.4 cents and in case of a strong breakout above that zone, we expect more upside towards the 25 cents area. On the other, the 4h chart 200 moving average seems to be the line in the sand dividing the bullish and bearish zone. We expect impulsive selling if the price breaks below it. However, right now, that doesn’t seem to be the case, with the price showing encouraging signs it will continue to break higher.


There are no comments at the moment, do you want to add one?
Write a comment