
BTCUSD Coinbase
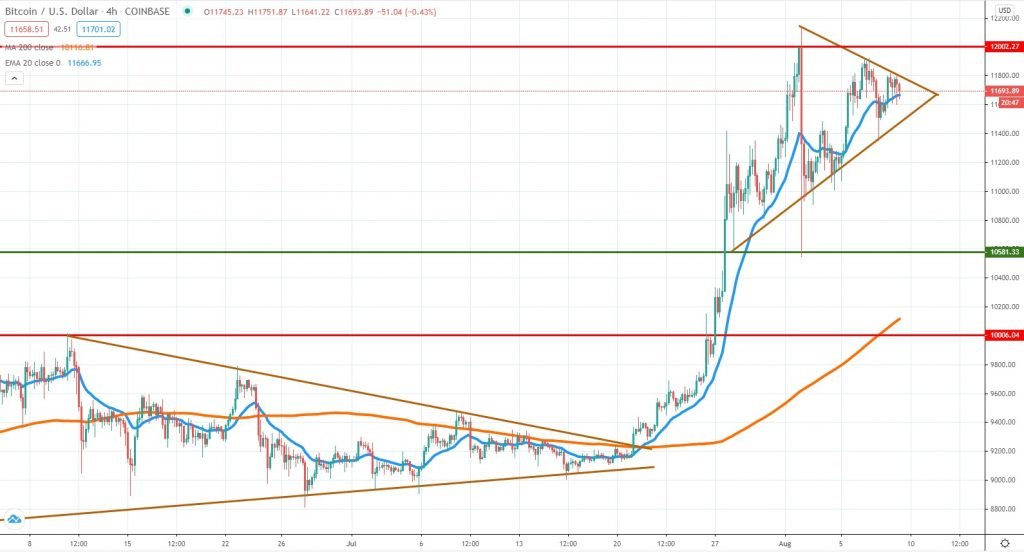
The Bitcoin upside momentum had weakened a bit during the past week since the price did not manage to break above the $12,000 key resistance area. Still, we can notice the buyers were active around the 4h chart 20 EMA, buying each short-term dip. At the same time, the price seems to be consolidating inside a triangle formation, with a break outside of it likely to signal the next direction.
Considering the activity is reduced due to weekend flows, we don’t expect any major Bitcoin action today. Watch for a break below the 20 EMA and the highlighted structure to get more confirmation that a corrective move lower will unfold.
On the other hand, a breakout above $11,800 will expose $12,000 and then we can even witness an extension higher. Did the impulsive selling candle highlight last week signaled a topping formation? That’ still under a question mark.
ETHUSD Kraken
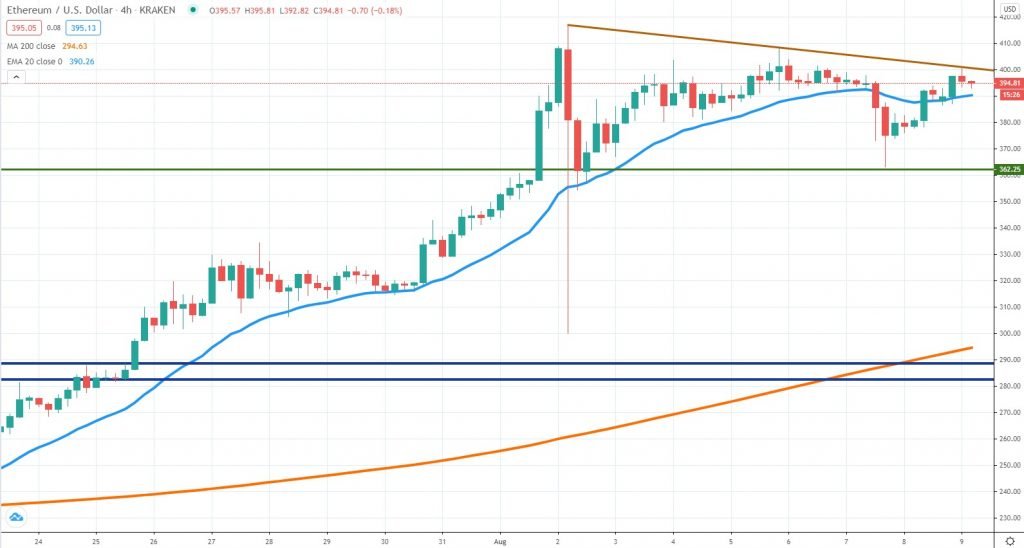
A similar situation can be found in Ether, which had been slowing down the pace of moving higher. For now, the market rejects the $400 key psychological and resistance area, not good news for buyers expecting the price to extend impulsively. In case sellers will continue to be active around it, we should get a new retest of the $362 key support area and role reversal level.
That had been a major resistance in the past and as we’ve seen two times recently, now the market is treating it as support. The short-term bias will switch to bearish only if the price breaks below that zone and never looks back.
All in all, this looks like a market taking a break following a very impulsive run and it will take a new major catalyzer to shake things up. Only a breakout above the August 2nd high could energize more buyers into the market, but at the time of writing, the buying activity is not as impulsive as it should be.
XRPUSD Kraken
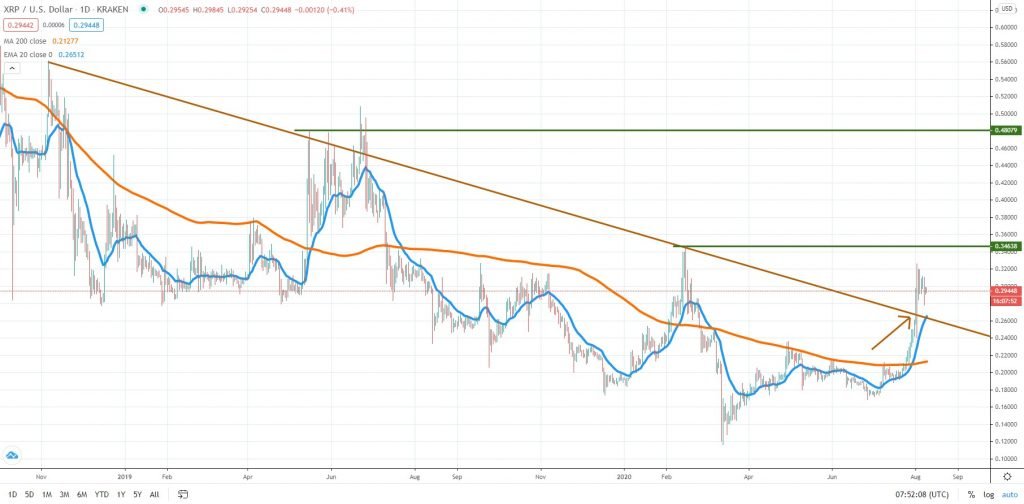
We did not cover XRP for a long time because the price action was in a pretty bad technical position. However, given the performance seen during the past few weeks, the developments are encouraging again.
As you can see from the chart, the price broke above a trend line going back to November 2018. A false break above it occurred in June last year, with renewed selling prevailing. Could things be different this time?
First, we will need to see the market retesting the broken trend line and find support there. The daily 20 EMA is also located around it and should help. If that would be the case, we expect XRP to extend towards the 34.5 cents area, where resistance could emerge. A break above that zone will unlock more upside in the longer-term, potentially targeting the 48 cents area.
Strong selling pressure pushing the price below the trend line again is the major risk for XRP, which could head towards the daily 200 MA in case sellers will keep the price subdued. Anything can happen at this point, but the good news is that volatility had been elevated and that’s good news for traders.


There are no comments at the moment, do you want to add one?
Write a comment