
BTCUSD Coinbase
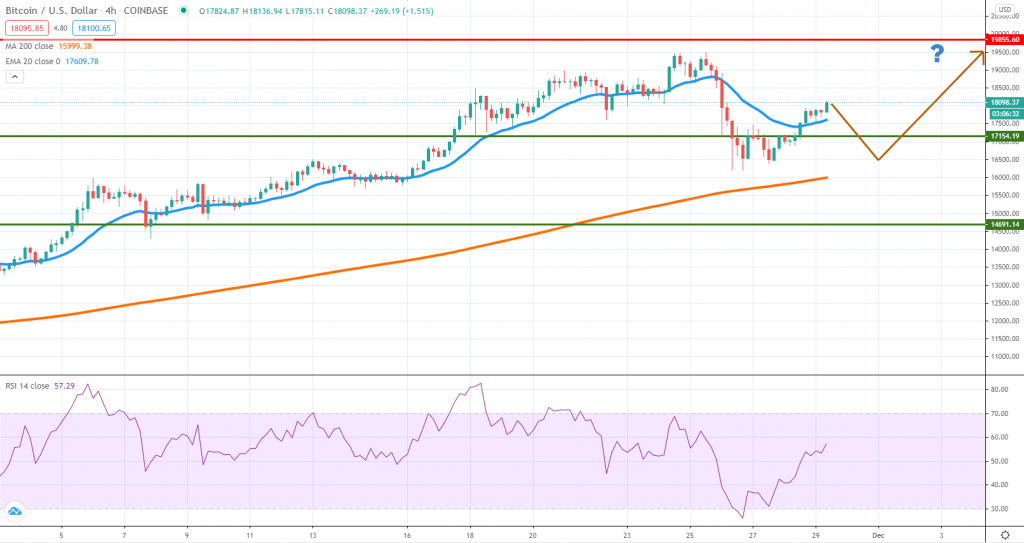
For the first time after seven consecutive bullish weeks, Bitcoin dropped by more than 10% in less than two days, banking the sharpest selloff since September 1st. The buyers stepped in around $16,200 and managed to push the price past $18,000, which means the token now has limited losses for the week.
What’s difficult to predict is whether the selling is just a one-leg exhausted corrective of we should expect a 3-wave move, followed then by a continuation on the upside. The momentum seems to be recovering but we suspect some selling might prevail on Monday, due to month-end flows.
Support is expected around the area formed by $16,200 and the 4h chart 200 MA. Watch out for breakout below the 20 EMA because that will be a short-term bearish signal. On the upside, $19,500 (the current weekly high) and the all-time high are where sellers might be active again. The selloff is not yet a reversal signal and that is why we suspect there could be more upside left for Bitcoin.
ETHUSD Kraken
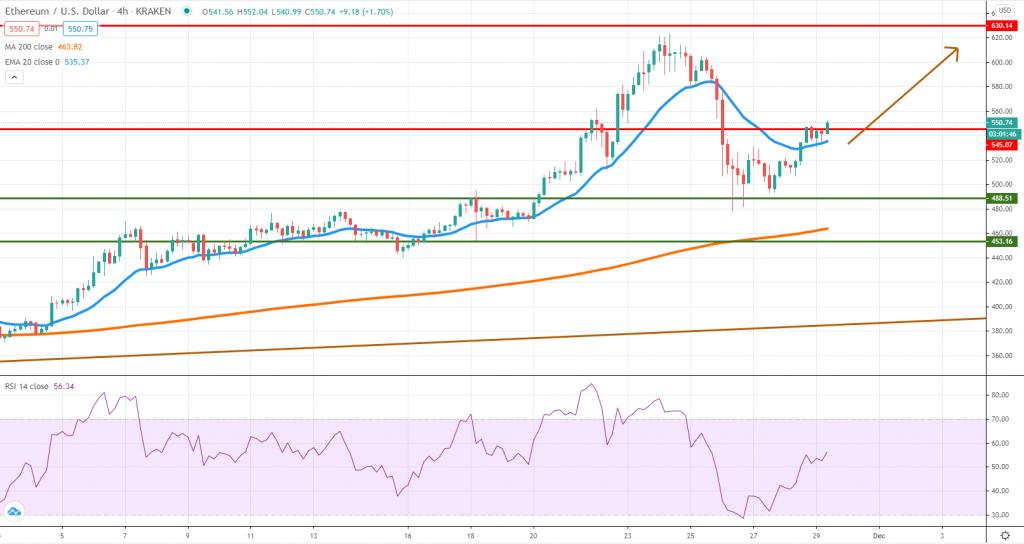
The selloff had hurt Ether more than Bitcoin, considering the token lost 25% of its value at some point this week. Such sharp corrections are a real problem for long-term buyers, which is why sticking to key technical areas is the best approach.
Buyers resumed around $488 a key level we’ve talked about during the past several weeks, as the RSI was trading in oversold conditions. The sellers did not manage to retest the lows and now the price trades near $550.
Due to weaker weekend activity, this will very likely be a losing week for Ether, but that does not mean sellers had done major damages. We suspect that during the next few weeks, the $620 highs will be revisited.
A double top formation around that zone will be a warning sign, but for now, buyers are recovering the lost ground and market participants are incentivized to join at more attractive levels.
XRPUSD Kraken
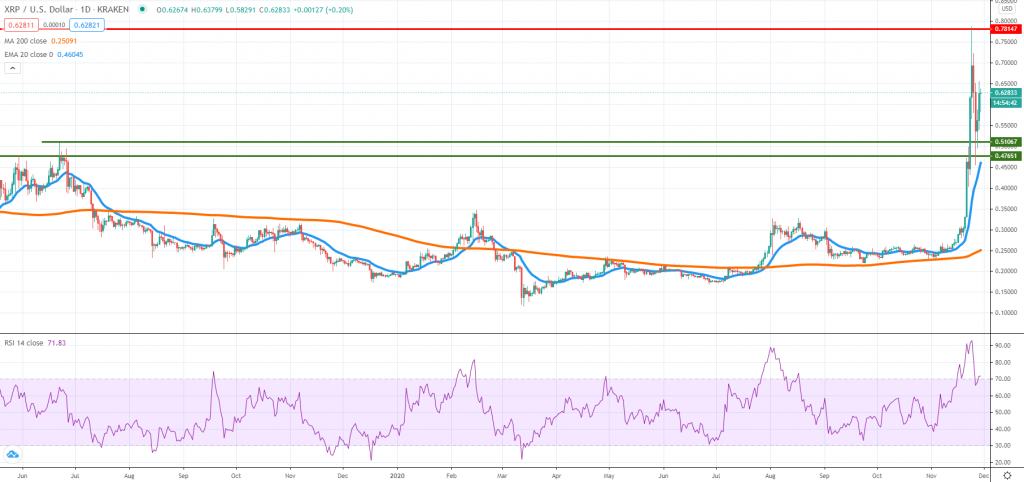
Since the end of October, XRP managed to jump by 200%, being one of the best-performing altcoins. The price broke above the 50 cents key resistance area and spiked towards 78 cents where it found some short-term resistance
The token had been hit by this week’s broad selloff, but support had been found around 51 cents – 47 cents, now a key role reversal area. Because of that, now we have a range in place, and until a break will occur, playing both sides can provide plenty of short-term trading opportunities. As the 3rd-largest cryptocurrency in the world, XRP had been playing catch-up with both Bitcoin and Ether this month. The positive momentum can extend into December when expectancies are for more gains due to favorable seasonality. Following the massive surge in XRP volatility


There are no comments at the moment, do you want to add one?
Write a comment