
BTCUSD Coinbase
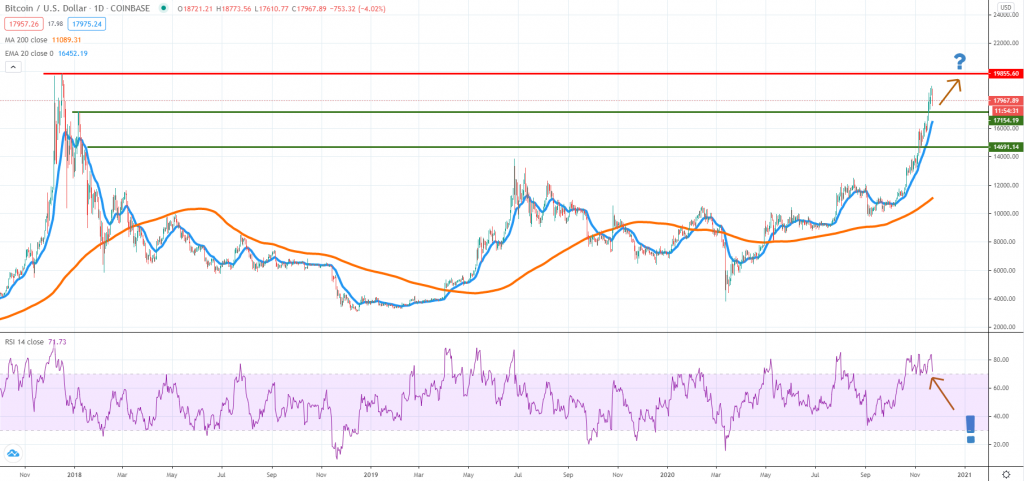
Considering the Bitcoin rally continues at the same impulsive pace, it is time to look around the December 2017 all-time highs. At the time of writing the price trades around $17,900 after reaching the $18,900 area a day before. As the price gets close to $19,850 we should expect to see choppier market activity, but that’s normal given buyers will start to take profits and sellers to rethink whether it would be the best place to short the market.
Support is expected to emerge around $17,150, where the January 2018 swing high is located. Below it, the daily 20 EMA will be where buyers could show some signs of activity. Above the all-time high, traders should look at how the $20,000 or $21,000 react. We think that’s where resistance could emerge and a deeper correction could follow, as the price starts to retrace from extreme overbought conditions.
ETHUSD Kraken
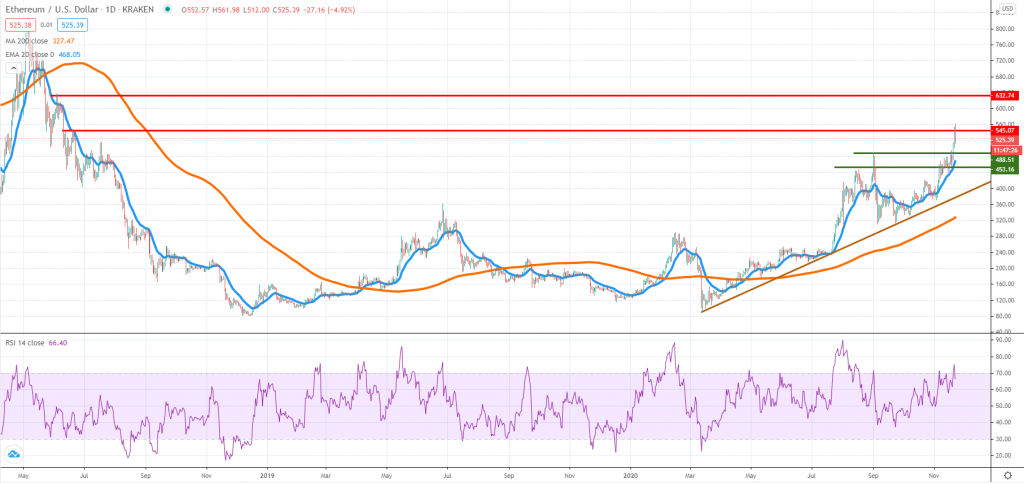
The ETH September high had been cleared and what followed was a continuation towards the $545 resistance area, where some activity can be noticed back in June 2018. The fact that the token reached levels not seen in more than 2 years is a major indication of the strong buying momentum.
Another important factor is that Ether is now outperforming Bitcoin in terms of 2020 gains. As the weekend trading activity continues, the price is now retracing some of the gains and looks poised to retest the September 1st high around $488. That should act as support and even it won’t happen, the daily 20 EMA stands near it.
To negate the bullish leg, sellers will need to break below the trend line which goes back to March 2020, and to do that, the price will need to fall below $360. Given how parabolic the bullish move is right now, that’s the less likely scenario and we suspect ETH could be headed towards $632, where short-term resistance could emerge again.
LTCUSD Coinbase
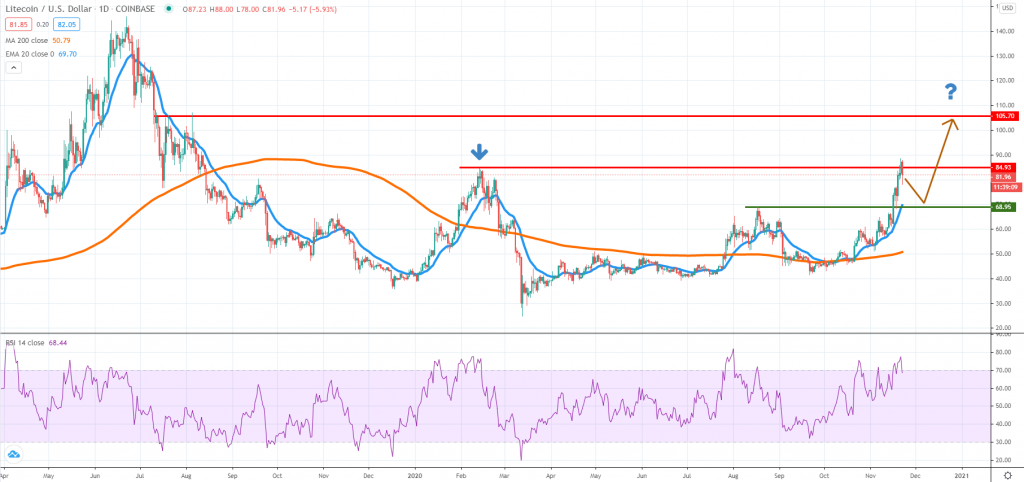
Although Litecoin had reached the February highs just three days ago, the token had managed to play catch-up and moved in line with other large-cap cryptocurrencies. The move is also parabolic, which raises the odds of a breakout and continuation towards the $100 – $105 resistance area.
A correction towards the daily 20 EMA should not be ruled out, especially now that there seems to be some short-term weakness in both BTC and ETH. Is this the beginning of a larger move higher or LTC will continue to trade range-bound, between $85 and $40 until a major buying trigger will occur?
Anything could happen at this point and the underperformance against other tokens is worrying. However, buyers continue to have the upper hand, based on the current price action developments. Key support is expected to emerge around $68 and if buyers resume impulsively, then a breakout above $84 will be increasingly likely.


There are no comments at the moment, do you want to add one?
Write a comment