
BTCUSD Coinbase
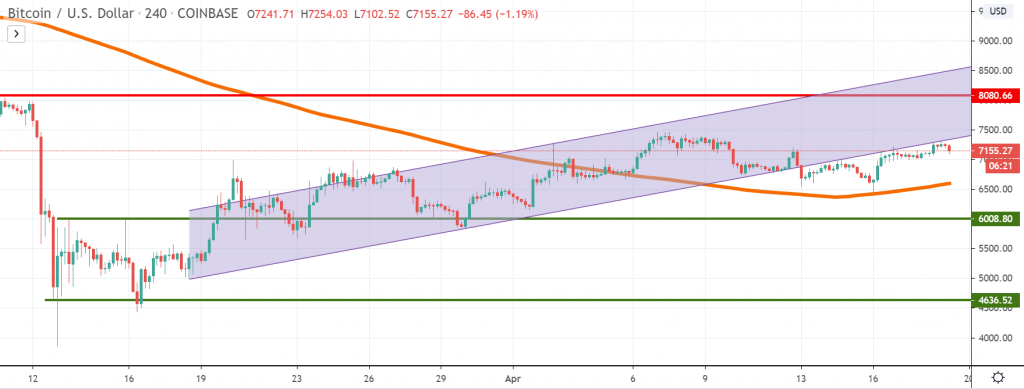
Bitcoin broke below the channel formation we’ve talked about in our last weekly crypto analysis but found support after touching the 4h chart 200 moving average. Since then, the price had retested the broken channel three times and buyers were unable to break back inside the structure.
The absence of either an impulsive continuation lower or a resumption of strong buying is putting Bitcoin in a bad position right now, with both buyers and sellers unable to assess what will be the next dominant direction. For the moment, traders wanting to place a trade should wait diligently until the price action will show signs of strong directional bias.
As long as the price trades below the channel, our view is slightly bearish and we expect to see a resumption of the selloff. A break above $7,500 will be beneficial for buyers and the parabolic move will continue to erase the March losses.
ETHUSD Kraken
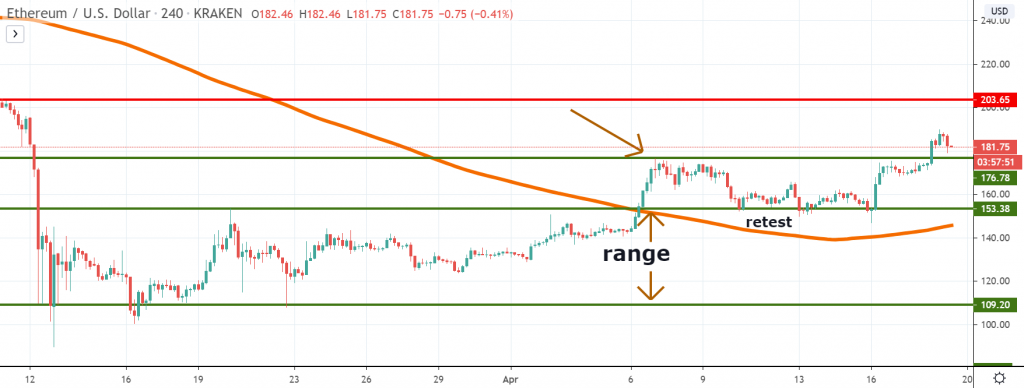
Ether is now in a much better position as compared to Bitcoin, after managing to break above the April 7th highs. Since the market had continued to generate higher lows and higher highs, that confirms there is increased demand for ETH, very good news for buyers. Since the price broke outside the range, buyers had been entering the market aggressively after every dip and so far they’ve been successful in pushing the price higher.
If the pattern will continue, we should expect to see support around the $176 area, which is where the April 7th high is located. A breakout below it could open more room for sellers, as the next support lies around $153, doubled by the 4h chart 200 moving average.
On the other hand, a continuation on the upside will encounter resistance in the vicinity of the $200 area. That’s a key psychological area and a place where the March selloff had started to accelerate. Ether had been an outperformer so far and even a weakening momentum will give it a slight advantage over other competitors.
LTCUSD Coinbase
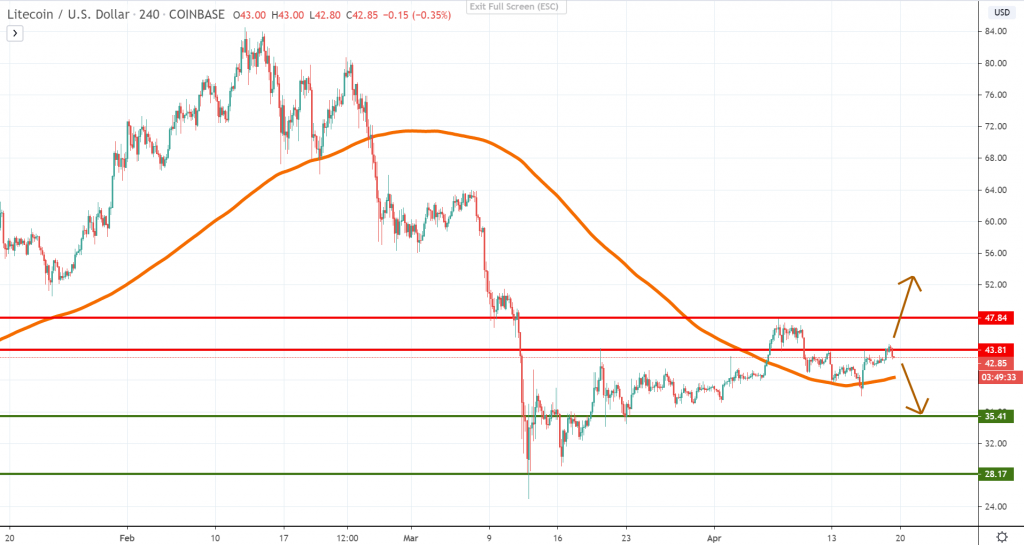
Litecoin had a similar performance with Bitcoin and found support around the 4h chart 200 moving average. However, it confirms that the market is in an uncertain position and predicting how the price will perform over the next few days would be difficult. The price had recently reacted to the $43.8 level, a resistance we’ve mentioned in the past.
That puts LTC locked in a range between the resistance level and the 4h chart 200 MA. Traders should wait for more confirmation in order to determine which side will have the upper hand. If the price will find support around the MA again, that will be a bullish factor, since it will create another higher low. Next, it should break above $43.8 to confirm that the buyers resumed impulsively.
A breakout below the MA will suggest a weakening of the bullish momentum occurred and the prospects for LTC will be downgraded. In case that happens, we believe LTC will head towards the $35 support area.


There are no comments at the moment, do you want to add one?
Write a comment