
BTCUSD Coinbase
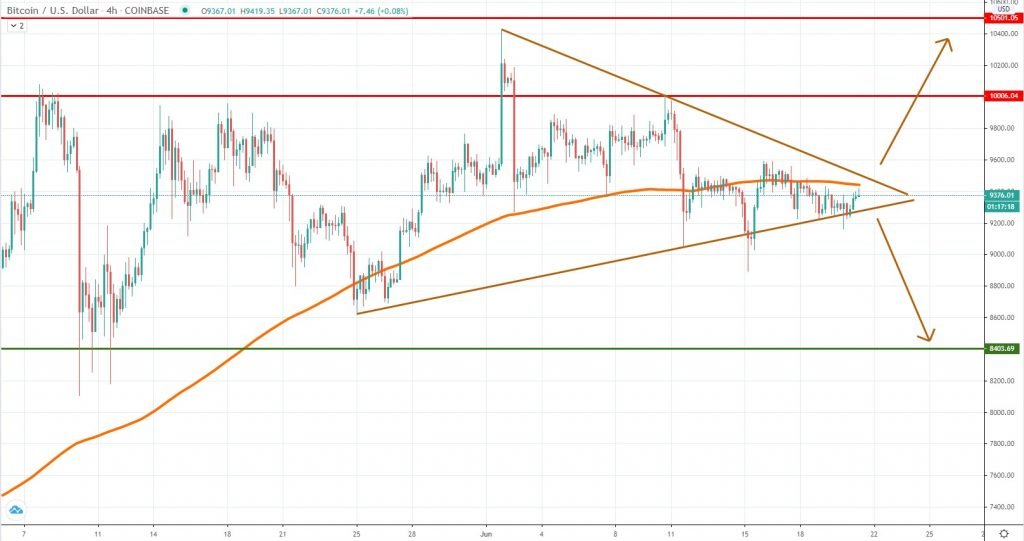
Bitcoin continues to quietly consolidate inside a triangle pattern, but since the formation is close to being filled, a breakout and spike in volatility look imminent. At this point, it is really hard to anticipate the next direction of price, considering the break will be the most important variable. What’s concerning is that the price had been consolidating below the 4h chart 200 MA, something which did not happen in the past two months.
That could be a sign of weakness and an indication the breakout will follow on the downside. In case that will happen, we expect Bitcoin to ease towards the $8,400 support area, where it reacted strongly on the 10th of May.
If buyers resume impulsively and break above the 200 MA + the upper line of the triangle, we expect the $10,000 and $10,500 resistance levels to become the next likely targets. In the past few days, uncertainty had been rising and this could affect the investor’s sentiment in the week ahead.
ETHUSD Kraken
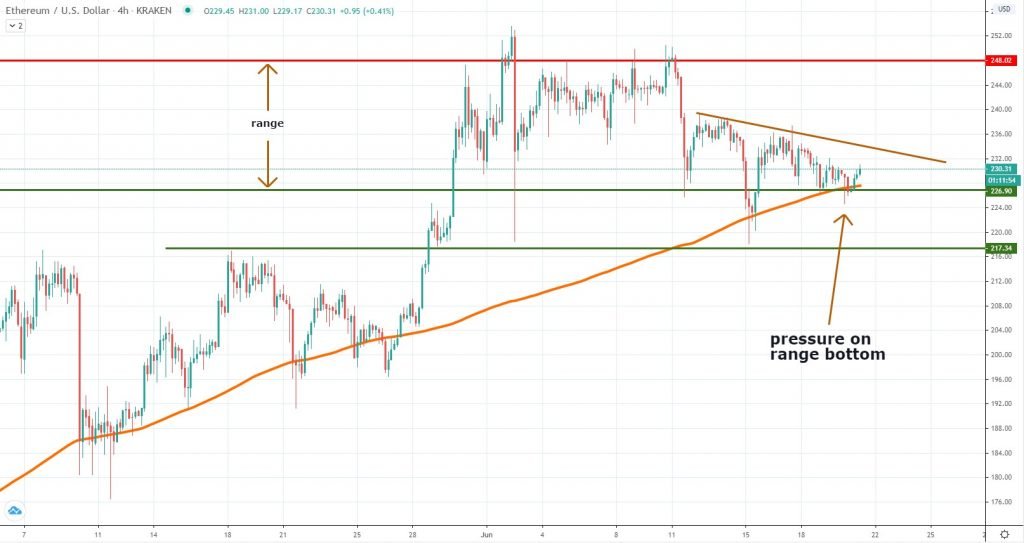
Ether continues to trade inside a range structure we’ve talked about already, but the price action developments seen in the past few days suggest the bullish momentum had been gradually fading. The price gets pressured towards the bottom line of the range + 4h chart 200 MA and thus far there isn’t any impulsive reaction from the bulls.
Although Ether had a pretty amazing run in the past few months, if we look at the price action performance from June 2nd (when the large bearish impulsive candle can be seen on the chart), sellers had been the ones in control.
Looking ahead, a break and continuation below the 200 MA will mean Ether is headed towards $217 or even the key psychological area around $200. The upside will remain intact as long as the price continues to trade inside the range. Sooner or later, the structure will break and that will point towards the next price action direction.
TRXUSD Bitfinex
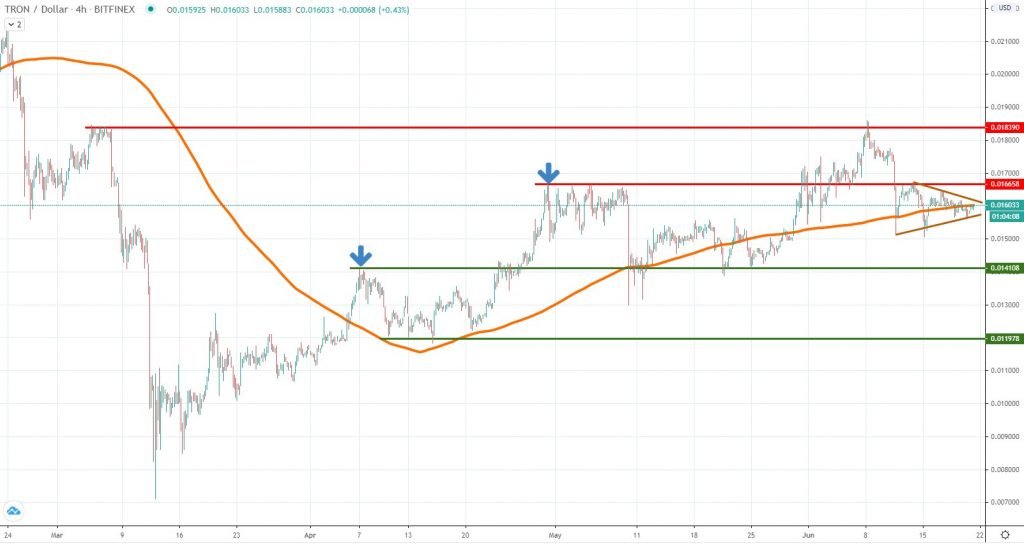
Since mid-March Tron had an impulsive run higher and we’ve covered the token several times as the price action development was very favorable for the bulls. It broke above previous ceilings (two of them highlighted in the chart) retested and then continued higher.
However, it seems things had changed, once the price broke below the 1.66 cents level. Buyers were unable to stage a new rally and instead the price is now consolidating in a small triangle formation. Same as Bitcoin and Ether, Tron is close to a volatility spike and all market participants should pay close attention.
A continuation lower will mean Tron should revisit the 1.4 cents support, but this will also deter the bullish parabolic structure which had developed since March. Below that, the 1.19 cents support should be watched for buying interest. The bullish sentiment will be back on its track only if the price breaks back above 1.66 cents and continues higher. We should be able to test again the June 8th high, if that will materialize.


There are no comments at the moment, do you want to add one?
Write a comment