
BTCUSD Coinbase
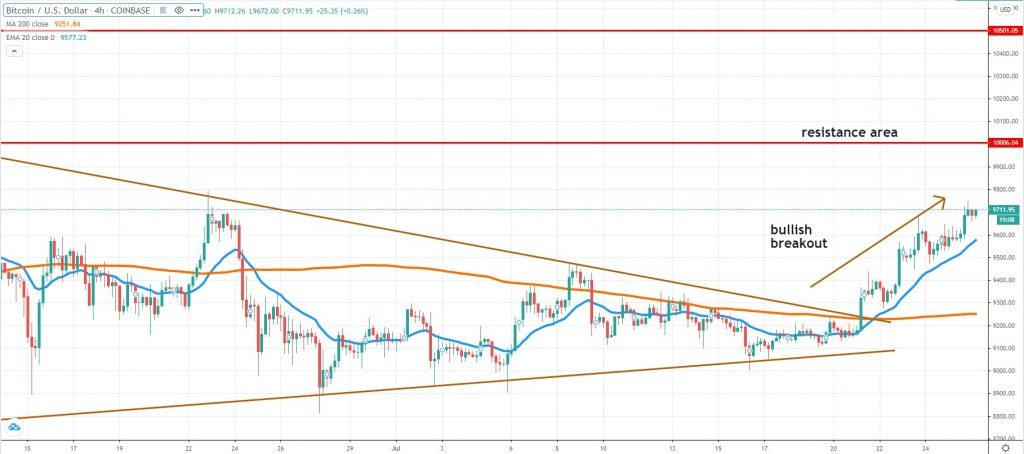
Bitcoin bullish activity had resumed after buyers managed to break above the triangle pattern we’ve talked about in our last weekly crypto analysis. At the same time, the breakout above the 4h chart 200 MA had been a major technical development, favorable for the bulls. As you can see from the chart, the price is floating above the 20 EMA, without even touching it since the break took place, communicating strong interest from the buy-side.
Looking ahead, we expect Bitcoin to continue on its way up towards $10,000 key resistance area. In case buyers push the price above it, look for weakness around $10,500. However, breaking above the June 1st high will be a major bullish sign and buying could continue further.
On the other hand, the $10,000 area could cap the upside and generate impulsive selling like it happened several times during the past few weeks. If that would be the case, we suspect a deeper pullback towards $9,200 is very likely. For now, the bullish scenario is the one in play, as the broad cryptocurrency market continues to benefit from inflows.
ETHUSD Kraken
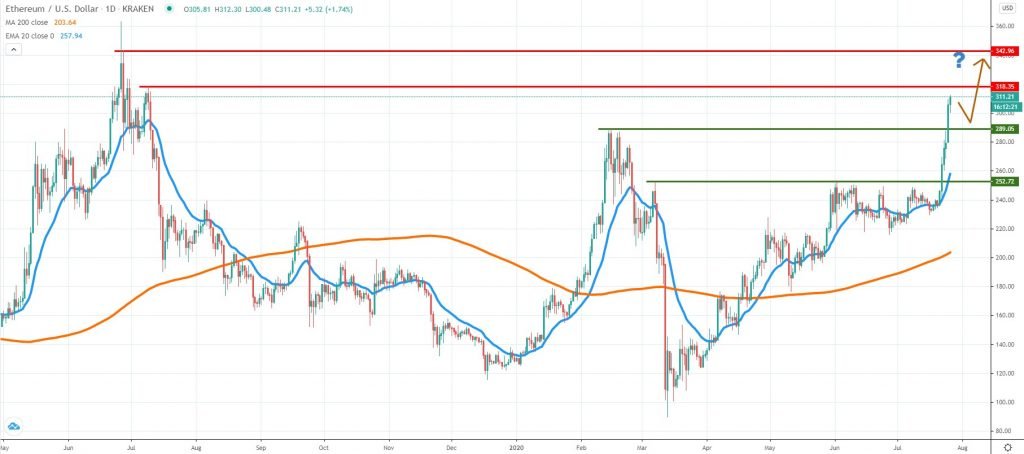
During the past week, Ether had outperformed Bitcoin by a large and managed to break impulsively above the February highs. That’s a major price action development, supporting more gains on the upside. The past 6 daily candles all closed green, showing how aggressive the bullish pressure continues to be.
Now that the previous 2020 highs had been cleared, the next areas to watch are $318 and $343, which is close to the June 2018 high. Based on the current development, there does not seem any reason why Ether should not continue higher.
However, pullbacks along the way should be expected. The key support area to watch is now $290, which is where the previous February 2020 high was located. We suspect buyers will treat it as an opportunity to get long. Only if an impulsive break below it, followed by weak buying, occurs, then we should change our outlook for Ether.
BNBUSD Binance
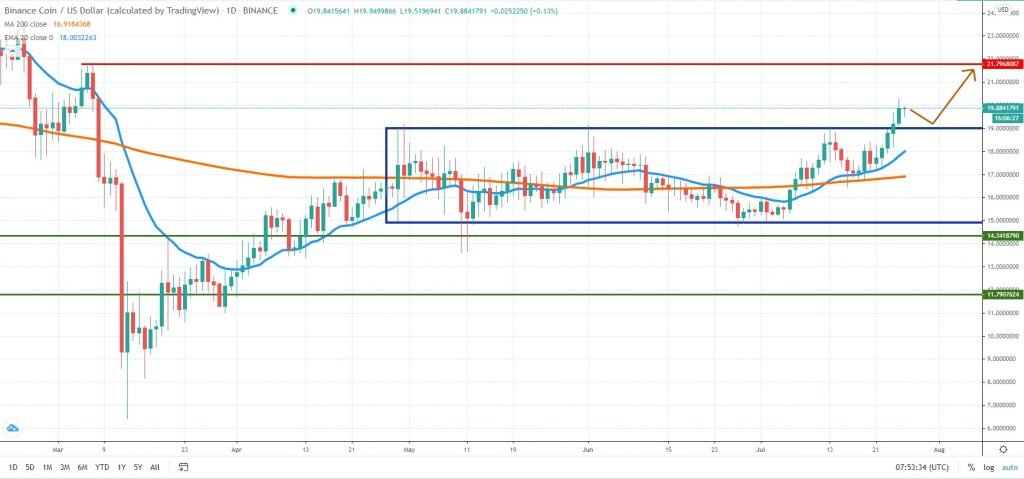
The latest Binance Coin developments are reinforcing the fact that funds are flowing into cryptocurrencies via exchange platforms. As a result, the BNB token broke the sealing of the range we’ve talked about several weeks ago. That’s an encouraging sign for the buyers, which are expected to continue erasing the losses since March this year.
If the price pulls back, then the top line of the range located around $19 should be a clear line in the sand. In case buyers will treat it as support, we suspect a new leg up will unwind and push BNB towards the $22 area, where resistance could emerge.
Only a strong breakout back inside the range will negate our current bullish view. However, the fact that BNB made a new swing high and cleared out some of the stop losses and now sellers are being squeezed out of the market. We keep a bullish view on BNB as long as impulsive selling does not return.


There are no comments at the moment, do you want to add one?
Write a comment