
BTCUSD Coinbase
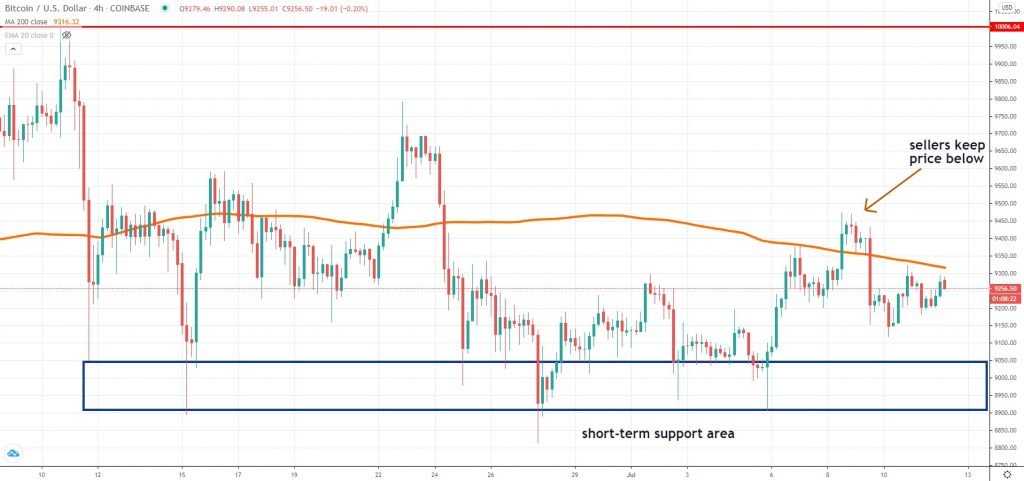
As we’ve expected in our last weekly analysis, Bitcoin was unable to break above the 4h chart 200 MA stay there. Sellers emerged with strength and now the price continues to consolidate below the moving average. The next week could be key in determining the next impulsive direction of Bitcoin.
We believe the price gets gradually squeezed towards a short-term support area around $9,000 – $8,900. A break below that zone will be a big hit for bulls since it could signal further weakness towards the $8,000. Be aware of the earnings season kick in the United States and if stocks start to tumble, so will Bitcoin due to increased correlation.
For now, the picture is favoring more selling, but we should also continue to monitor how the price will react around the MA. A breakout followed by consolidation will suggest a change of hands occurred and the price may continue back towards the $10,000. Our bullish scenario, though, seems to be less likely, but anything can happen in a volatile market.
ETHUSD Kraken
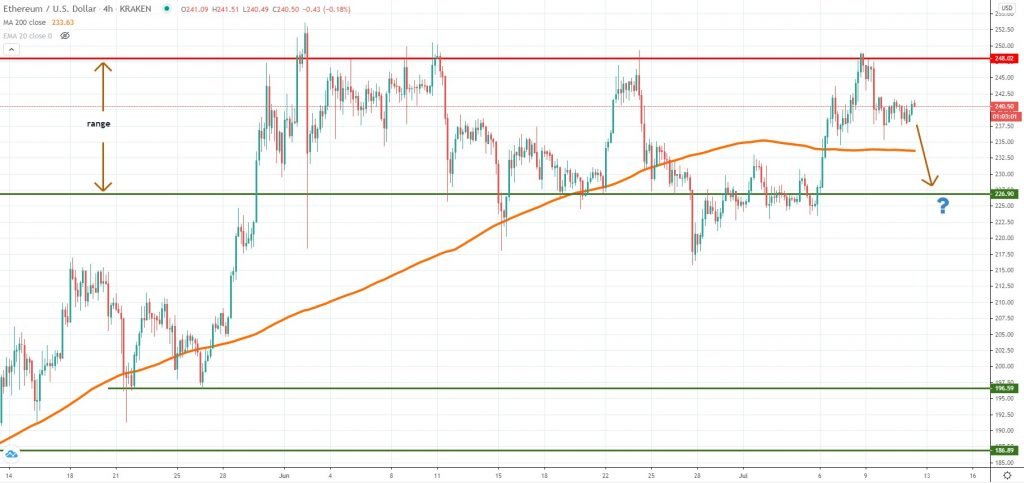
Ether continued its surge inside the range, but for the fifth time, sellers capped the upside and weakness had already started to show. The $248-$250 area is key for the market since we see a lot of selling orders parked around it. Given the buyers were unable to break higher, we expect further weakness, at least until the 4h chart 200 MA.
Continued weakness will push ETH towards the $226 level, where the lower bound of the range is located. The price is locked inside the structure since the beginning of June and when it breaks, expect a very impulsive move in the direction of the breakout.
The near-term could be tricky since we’ve already had a false breakout on the downside. Until a stronger break occurs, market participants should play both sides of the range, given how many trading opportunities had emerged in the past month and a half.
BNBUSD Binance
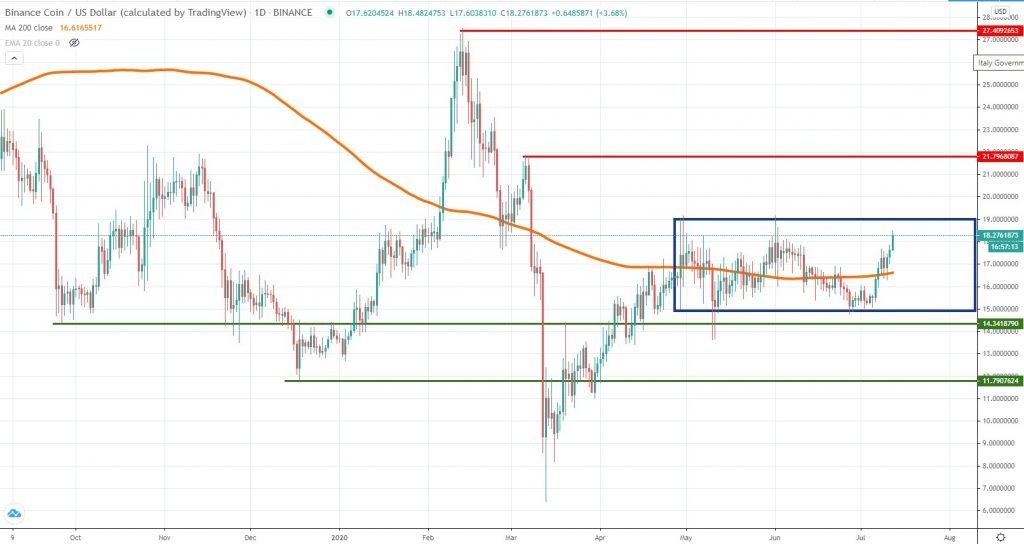
Since the end of April, Binance Coin had also been locked inside a range. The price is now moving towards the upper line, which is where it could find resistance once again. Traders should monitor how the price reacts around $19 because that’s where selling activity could intensify.
Weak reaction from the sellers could mean a breakout higher is imminent. That will mean the price will continue to recover from the March losses and edge towards $22. If selling will emerge around $19, we could see BNB easing at least towards the daily 200 MA, a critical support area.
From a longer term perspective, it is possible to see the price continuing on its way higher. However, we expect a bumpy road ahead and at this point, anything can happen. Until a major technical development occurs, play the range that’s in play. Sooner or later, it will break, but for now, buyers and sellers and comfortable to trade the structure.


There are no comments at the moment, do you want to add one?
Write a comment