
BTCUSD Coinbase
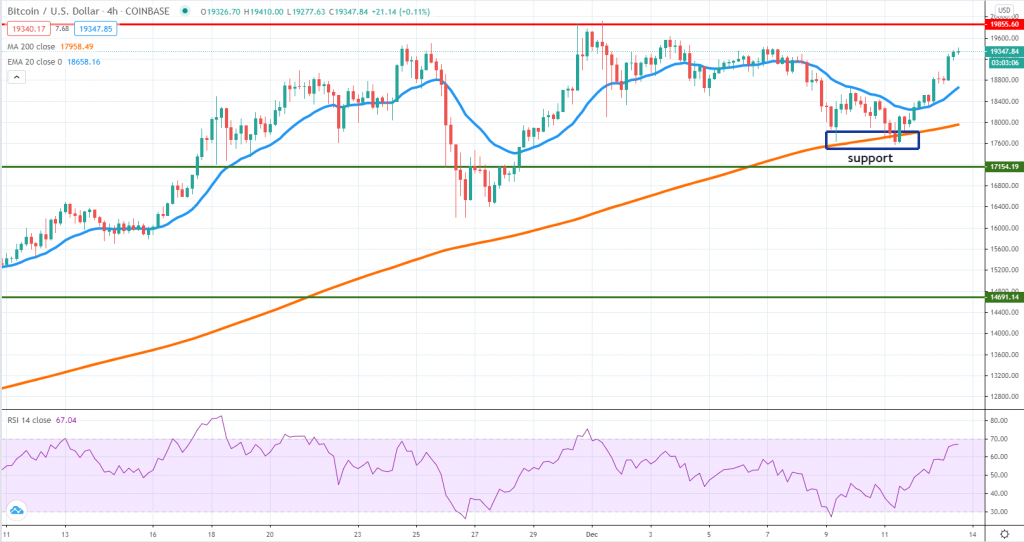
The weekend activity had been bullish for Bitcoin thus far and now it looks like the all-time high will be under pressure again. Since the price found support around the 4h chart 200 SMA, it is very likely that now buyers had resumed in force and will threaten to break above $20,000.
Taking into consideration the impulsiveness of the bullish move, the $19,850 is the short-term resistance level, with more upside potential unlocked in case a breakout will occur. It looks like the price action is locked in a range between the 4h chart 200 SMA and the all-time high.
Bears will retake control over the order flow in case the price will break below the SMA. That’s the least likely scenario now, but a short-term correction should be expected given the RSI is nearing overbought conditions. Overall, Bitcoin is well-positioned to start the new week in a good pre-breakout setup, with plenty of upside to be explored.
ETHUSD Kraken
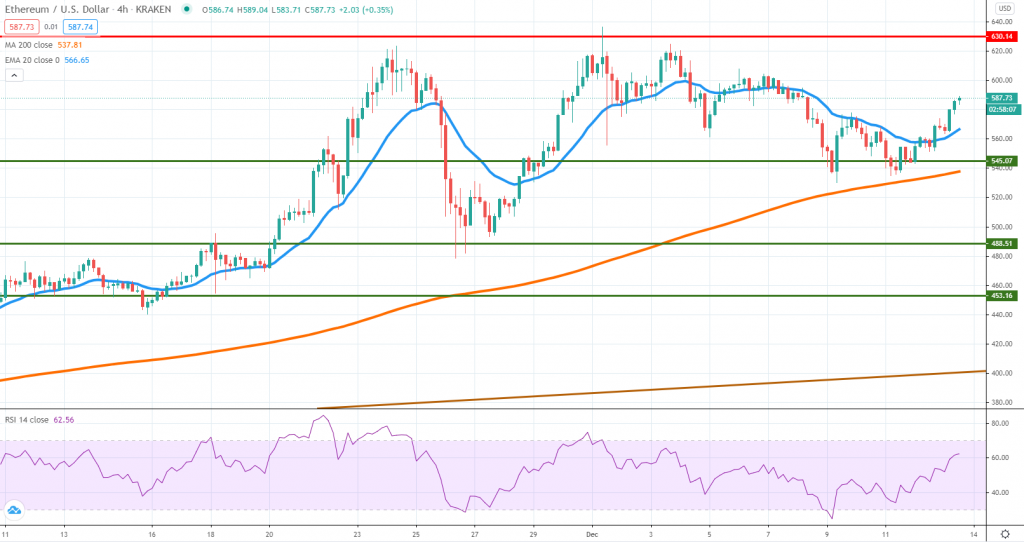
Ether weakened during the week but after a short-term double bottom, the price action is back on the upside, threatening to reach $600 once again. Since the end of November, ETH is in the consolidation phase and so far, buyers were unable to break the structure.
Breaking above $600 will be a good development for buyers since that could mean pressure will be building on the $630 key resistance level. That is where sellers resumed with strength on December 1st and it is where we suspect some profit-taking might occur.
Should a breakout above happen, more upside potential will be unleashed, potentially driving Ether towards $650 or $700. A Santa Claus rally had not occurred yet, but there is still time for bullish strength heading into the holidays. At the same time, market participants should expect narrower ranges and choppier moves as liquidity will gradually diminish, with traders and investors taking a break.
BNBUSD Binance
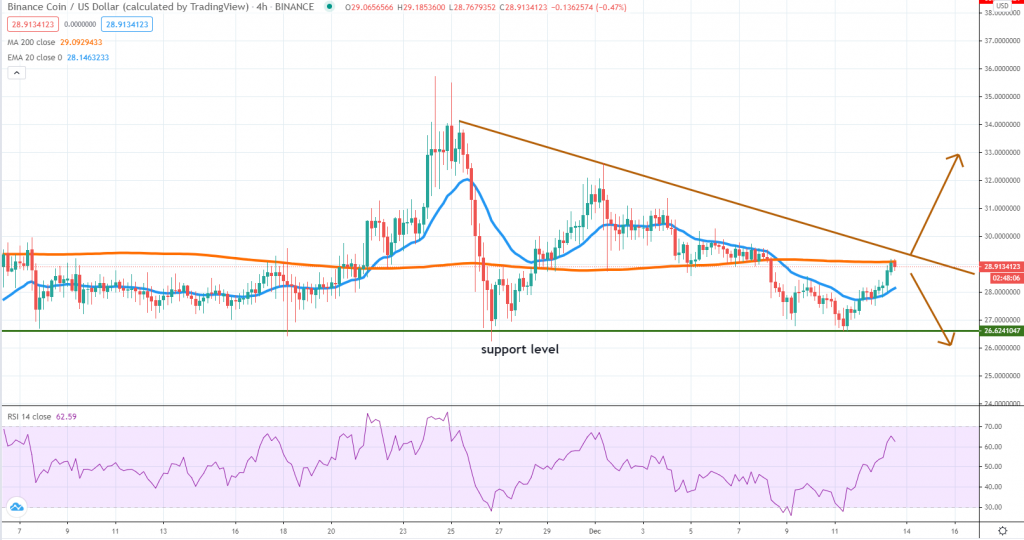
Binance Coin had been trading in a compressing range since the end of November and as daily ranges continue to get smaller, a breakout on either side will be increasing likely. For now, the buyers had not been able to break above the 4h chart 200 SMA and above a falling trend line.
Such a development will mean BNB can move higher heading into 2021, with $34 as the near-term resistance area. Buyers shouldn’t rush to buy until the breakout materializes, since weakness could emerge during the next few days.
In case the price will remain locked inside the structure highlighted in our chart, then a correction towards the $26.6 key support level would be increasingly likely. So far, buyers had shown a commitment to keep the price action above it, but at this point, anything can happen. A break below that will mean BNB could dip towards $20, a key psychological area.
The end of November saw the token selling up impulsively and since then, the market’s activity had been rather muted. There could be one last impulsive move before Christmas.


There are no comments at the moment, do you want to add one?
Write a comment