BTCUSD Coinbase
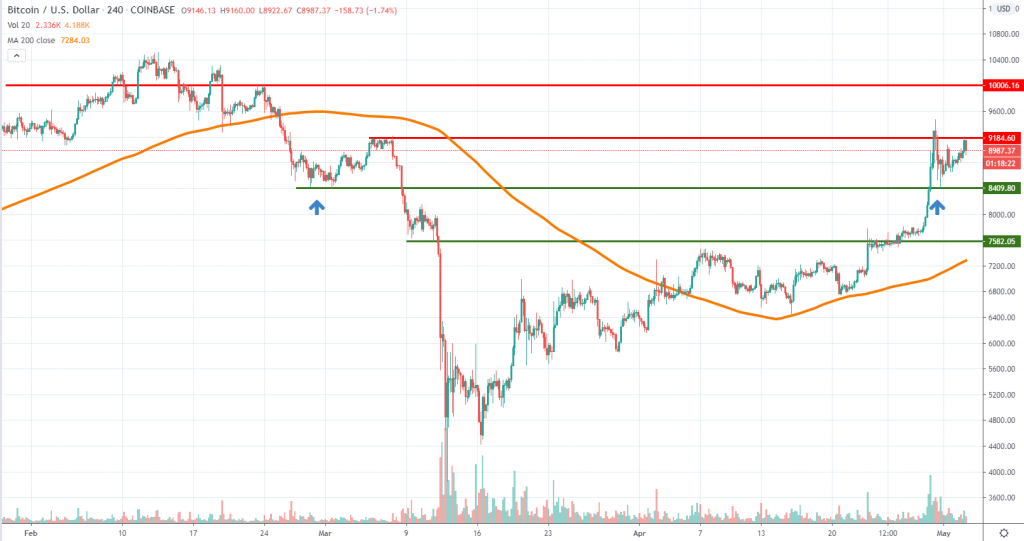
After hovering around the $7,500 area for a few days, the Bitcoin price action had accelerated on the upside the past week and almost reached the $9,500 area on the Coinbase exchange. Given the parabolic structure had accelerated on the upside, backed by high volume, this could be indicative of some more gains as we move forward.
In case the price will break and close above $9,200 on a daily basis, we suspect the next near-term target is located around the key $10,000 area. Above that, there little left until the February highs and some more selling could emerge.
On the other hand, selling driving the price lower could expose the $8,400 support again. Breaking below it will open more room towards the previous key area around $7,500. This is a parabolic structure and at some point in time, it will come to an end. Generally, the counter-trend move is very violent, and buyers should be careful when placing orders.
ETHUSD Kraken
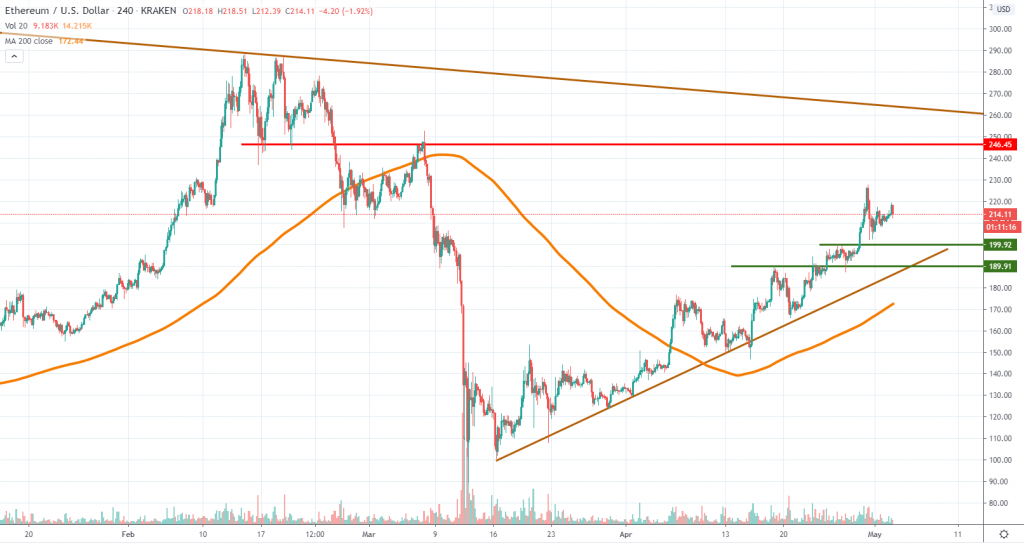
Same as Bitcoin, Ether had a solid week and finally manage to break impulsively above the $200 area. However, at first glance, we can notice a stronger counter-trend move, which could be indicative of some more selling in the days ahead. If the price retraces lower, look at how it behaves around $200 or $190. Also, there is an ascending trend line going back to mid-March still in play.
We have a bullish parabolic structure in this case and if it will continue, we expect the $246 area to act as resistance. There’s little room above it, given we have a strong bearish trend line located around $260. A break above the current week high will point towards more buying in the short run. We advise caution when buying at these high levels since the month could turn out to be very volatile.
BNBUSD Binance
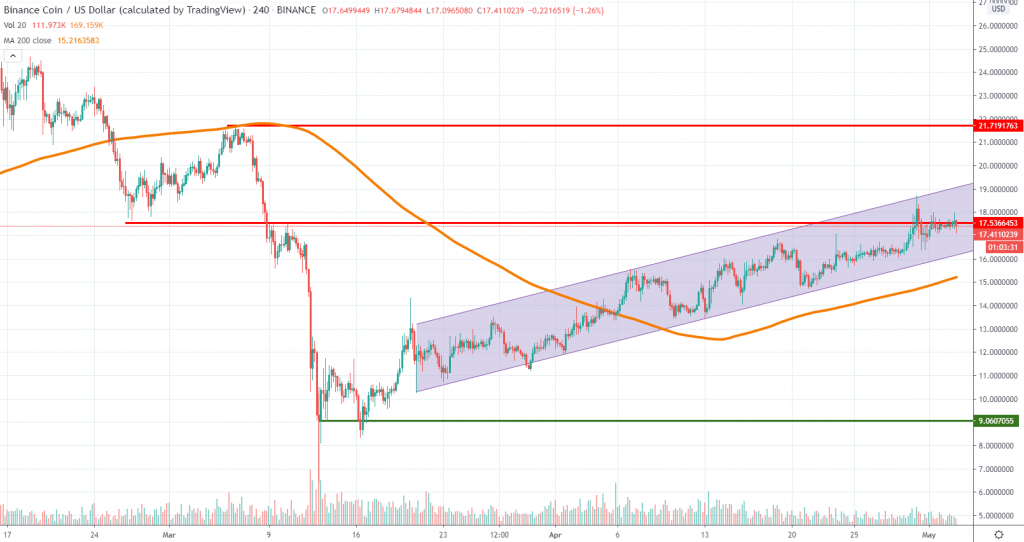
Binance Coin had been climbing steadily since mid-March and so far the price action development had been very quiet. We can easily notice how it moved higher inside a bullish channel formation, confirming the overall bullish market sentiment. Each time sellers jumped in aggressively, buyers reacted and bought the dip, creating a series of higher lows and higher highs.
The price action trends above the 4h chart 200 moving average and the relatively-narrow channel is also suggesting that volatility is very low. Things could take a turn in case the market will start to move south. Either way, we expect the channel to be broken during May and the direction of the breakout will determine where is BNB headed.
A breakout below the channel + the 200 MA will be a very bearish signal and could mean the price will head back towards the $9 support area, which is close to the March lows. A continuation higher, on the other hand, will mean BNB is poised to retest the $21 key resistance area. Right now the parabolic structure is in play but watch for any impulsive selling because that will turn the tide.


There are no comments at the moment, do you want to add one?
Write a comment