
BTCUSD Coinbase
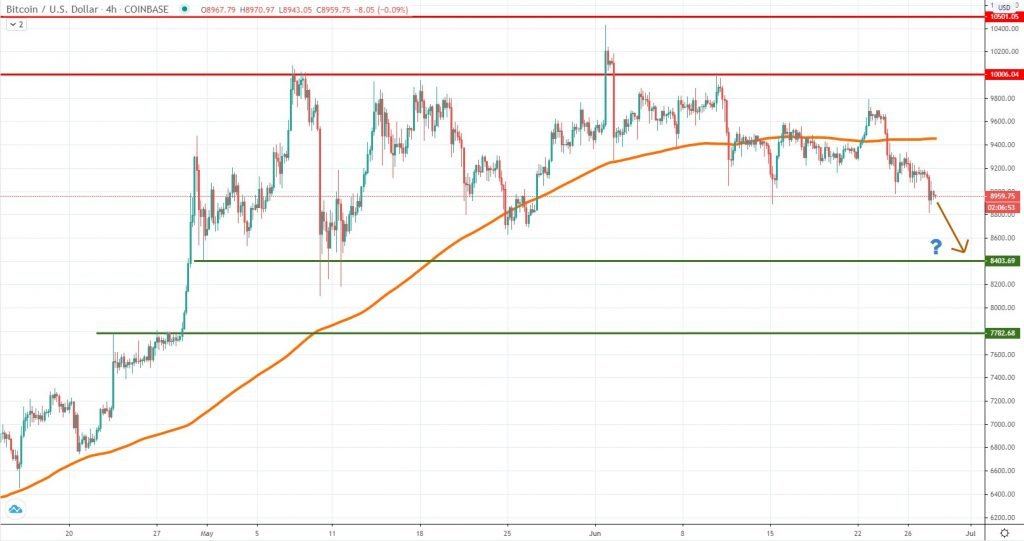
Bitcoin had broken impulsively below the 4h chart 200 moving average and since then it continues to be under selling pressure. At the time of writing is sits little under the $9,000 mark but we believe there is more room to go on the downside. From a broader picture point of view, it seems like BTC is ranging between the $10,000 and $8,400 since the end of May.
As a result, our next downside target is around $8,400. Failure to contain the downside will mean Bitcoin is very likely headed towards $7,700 in the near team. It’s all about risk sentiment in the days ahead and as long as financial markets will be under pressure, Bitcoin will have to suffer.
Small corrective moves higher should be regarded as opportunities to get short. We believe sellers might get aggressive again in case the price reaches $9,200 or the 200 MA again. Only a breakout above $9,800 will negate our current bearish view.
ETHUSD Kraken
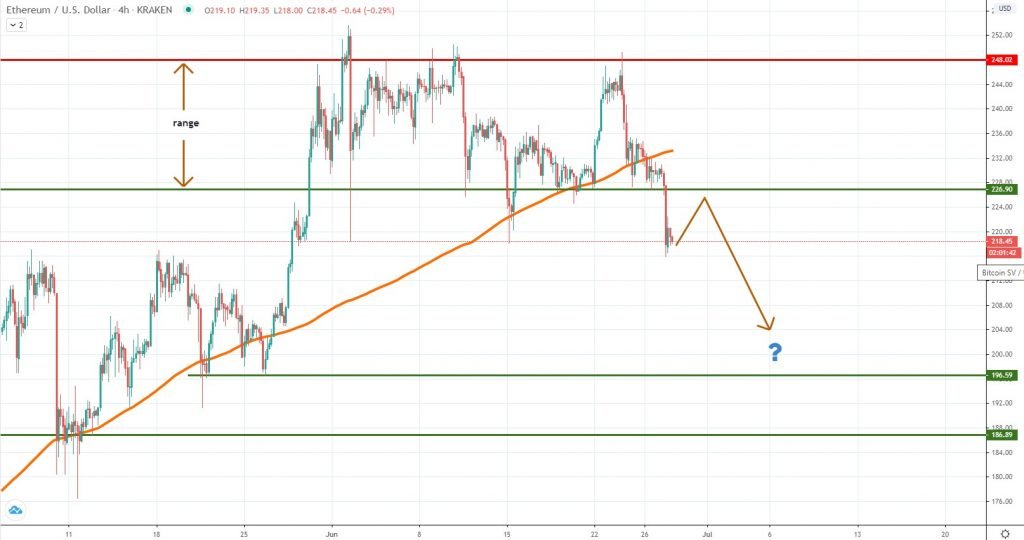
It was obvious that at some point ETH will break outside the range we’ve talked about for the past two weeks. Sellers seem to be the clear winners and thus the short-term picture had shifted towards the bearish side of the market. It is possible, though, the see a retest of the broken structure before we continue to move impulsively lower.
While below the 4h chart 200 MA, Ether is bearish and we expect it to continue to weaken towards the $196 or the $186 support levels. That happens because the price did not move so far below the 200 MA since April and it communicates sellers have the upper hand.
On the upside, expect heavy resistance around $227 and around the 4h chart 200 MA. There may not be the case for a retracement if the price will continue to weaken in the next two or three days.
LTCUSD Coinbase
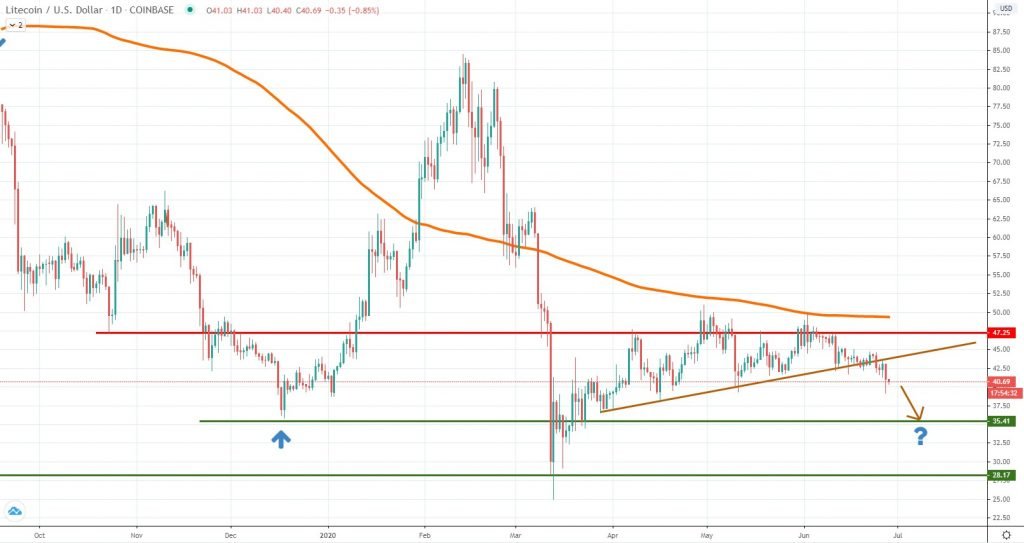
The broad market weakness it’s obvious if we look at the Litecoin price, which had broken below a short-term trendline four days ago. What’s even more concerning is that LTC did not manage to erase the March losses, a detail supporting further downside losses. We suspect the price is headed towards the $35.41 area, where support had been found in the past.
Failure from the bulls to contain the downside could result in accelerated selling, leading to a retest of the March lows. Anything could happen in the next few weeks, but at this point in time, we believe the probability of breaking below March lows is high, meaning the entire market might be poised for more losses.
If Litecoin breaks back above the trend line, then the current negative sentiment will disappear, and buyers could push the price towards $47. The daily 200 MA is next on our list, but keep in mind the bullish picture is the less-likely scenario right now. Sellers might sell on rallies and that will cap the upside for LTC.


There are no comments at the moment, do you want to add one?
Write a comment