
BTCUSD Bitstamp
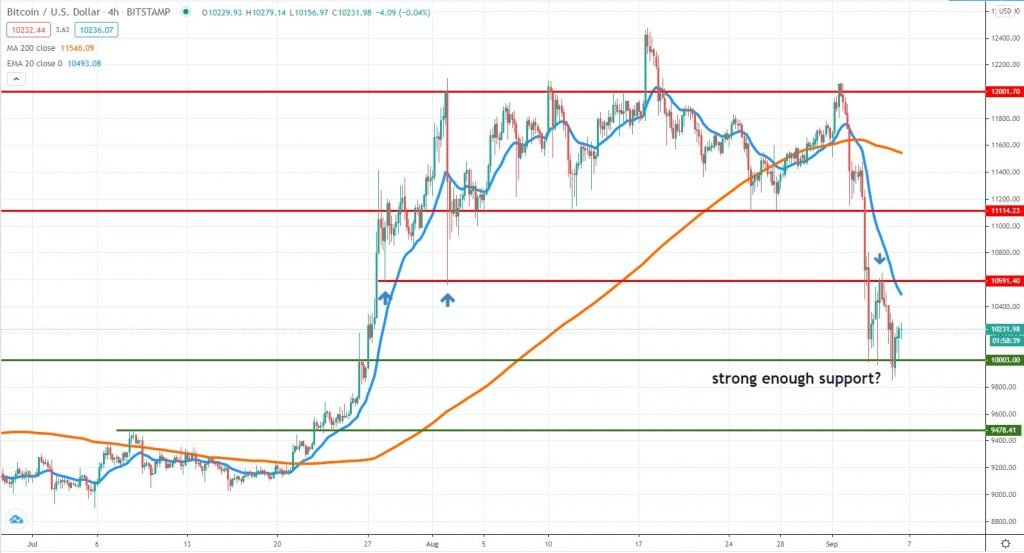
In our last weekly crypto analysis, we were right in our assumption that Bitcoin can continue lower, towards the key $10,500 support. The selling pressure had been stronger than we have thought, and the price actually found support around the $10,000 key support area. The market activity is calmer now that weekend is still underway, but whether or not the selling can continue next week is still uncertain.
Buyers should look on more confirmation to see whether the $10,000 area is a strong enough support. More selling below it will push the price even further on the downside, towards the $9,500 area.
On the other hand, sellers had been active around the $10,600 on September 4th and now that the 4h chart 20 EMA had also declined, that could be a supply area to watch for. Given the impulsiveness of the move, the market sentiment is on the bears’ side, but as we’ve seen multiple times in the past few months, impulsive buying can resume at any point.
ETHUSD Kraken
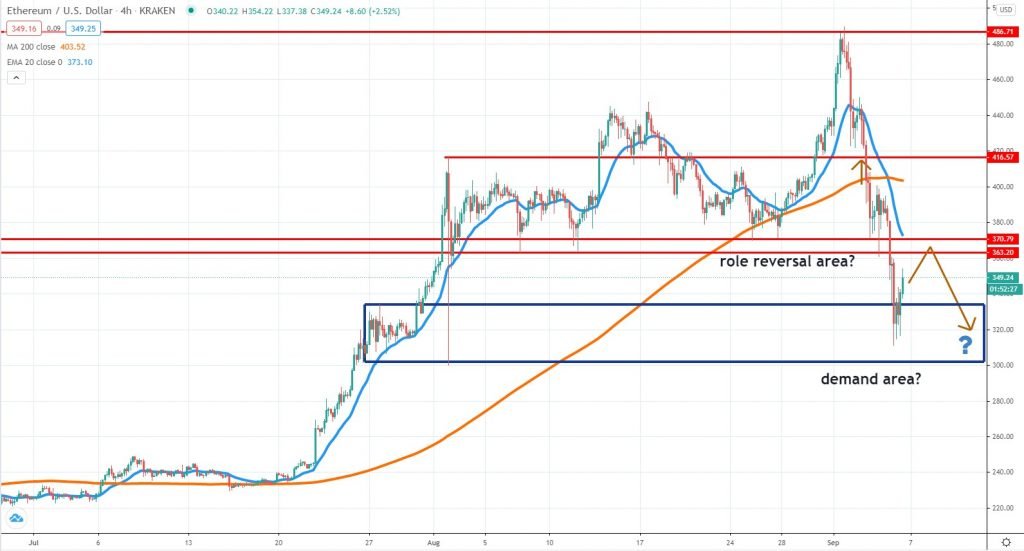
Ether had taken an even greater price hit, dropping more than 30% in less than 4 days. This is the largest selling move since March and had definitely dampened the strong bullish momentum that persisted for months.
The price pierced through the $363-$370 key area and found temporary support around $310. We believe the wide area between $330-$300 is a strong demand zone and if the selling won’t break impulsively lower, the downside for Ether should not be very deep from the current point.
However, given the impulsiveness of the move, we should expect to see selling activity in the upcoming days. Sellers could rejoin around the role reversal area or the 4h chart 20 EMA. On the other hand, $300 is a strong area to watch for buying activity.
We are way below the 4h chart 200 MA, showing that Ether switched to bearish in a relatively short period. This move only confirms what we’ve warned for months – that the crypto market sentiment is very fragile.
LINKUSD Kraken
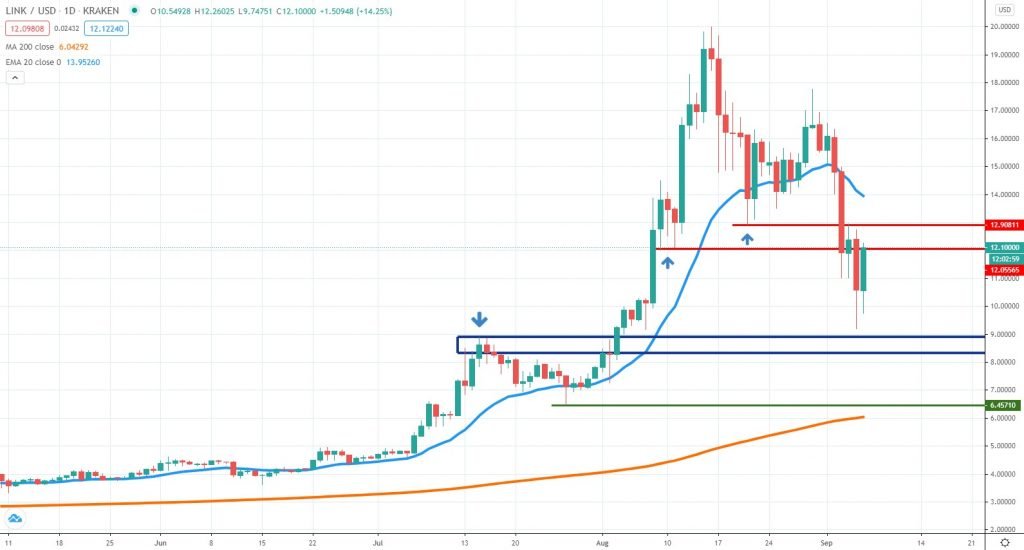
At first, encouraging and enthusiastic, the Chainlink rally gradually turned into a bubble and the performance we’ve seen during the past weeks only confirms what we’ve warned about for a long time. The price dropped from $20 to sub-$10 levels before finding support, accounting for a 50% retracement.
Faced with impulsive selling, the bullish sentiment had been severely damaged. Still, that does not exclude short-term spikes on the upside. We believe $12.9 and the daily 20 EMA are two of the key resistance areas to watch in the near term.
On the other hand, continued downside will put under pressure the support area between $9-$8. If that will fail, then we should expect to see Chainlink weakening towards the daily 200 MA. This is clearly a typical pump-and-dump scheme and unfortunately, a lot of buyers had been trapped at higher valuations. The broad market performance is expected to have an influence on Chainlink, as well, looking forward.


There are no comments at the moment, do you want to add one?
Write a comment