
BTCUSD Coinbase
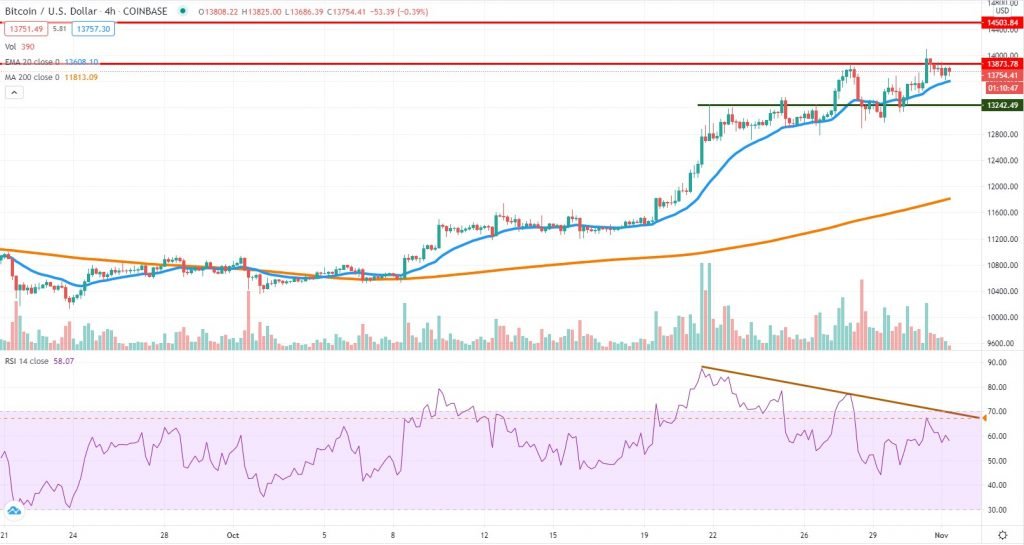
The Bitcoin rally continues relentlessly, even though financial markets had been under pressure the past week. As we can see from the chart, buyers are pressing the 2019 highs and even managed to briefly break above, suggesting the momentum continues to be strong.
In case the price will manage to stay above the first red line, that could open more upside potential towards $14,500. The is nicely trending above the 4h chart 20 EMA, treating it as a dynamic support level and as long as that won’t change, the upside is intact.
However, we should not ignore some of the early warning signs. The most important is the divergence in the RSI. As the market keeps positing new highs, the RSI forms lower highs, and that could signal some weakness in the short-term.
Traders should carefully monitor the market’s performance at the beginning of the new week because pressure could start building in BTC. Breaking below the EMA could push the price towards $13,250 or even $13,000.
ETHUSD Kraken
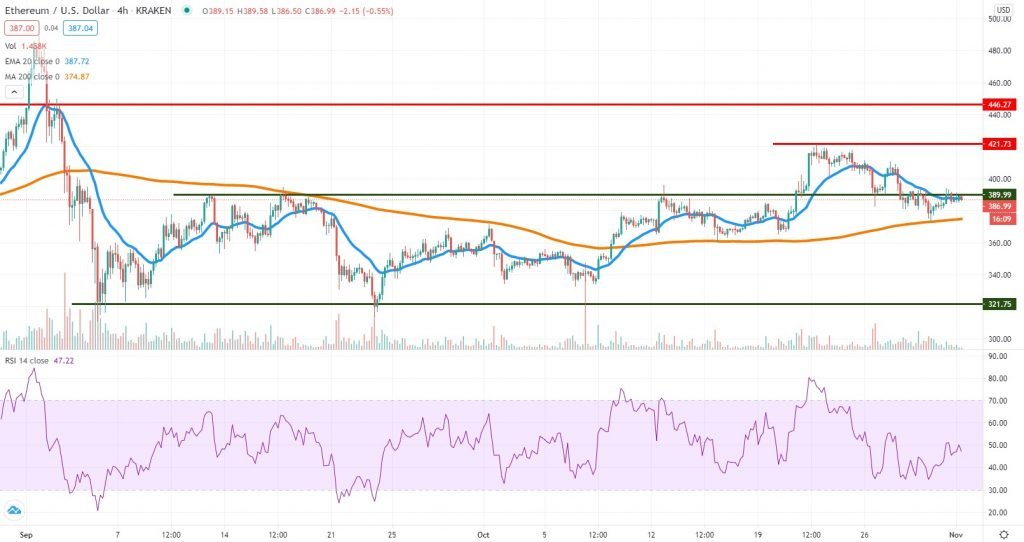
Ether had a completely different performance last week, finding resistance around $420 and dipping below $390, although support was expected there. More than that, the price continues to trade below the September highs and that’s not a good sign in case the sentiment will deteriorate further in the coming days.
The 4h chart 200 SMA is the next meaningful support area and if the price will continue to move lower, we suspect there’s more downside ahead, potentially towards $320, where support was found twice in September.
On the upside, we expect $420 to be the first meaningful resistance area. That’s where ETH started to drop on October 22nd and sellers could look around it to sell once again. A break above that zone will be an important short-term development, considering it will show that higher highs are developing. In that case, watch for $446 as the next key resistance.
Right now the RSI is trading around the 50 area so the price could move in either direction at the beginning of the new week.
ADAUSD Binance
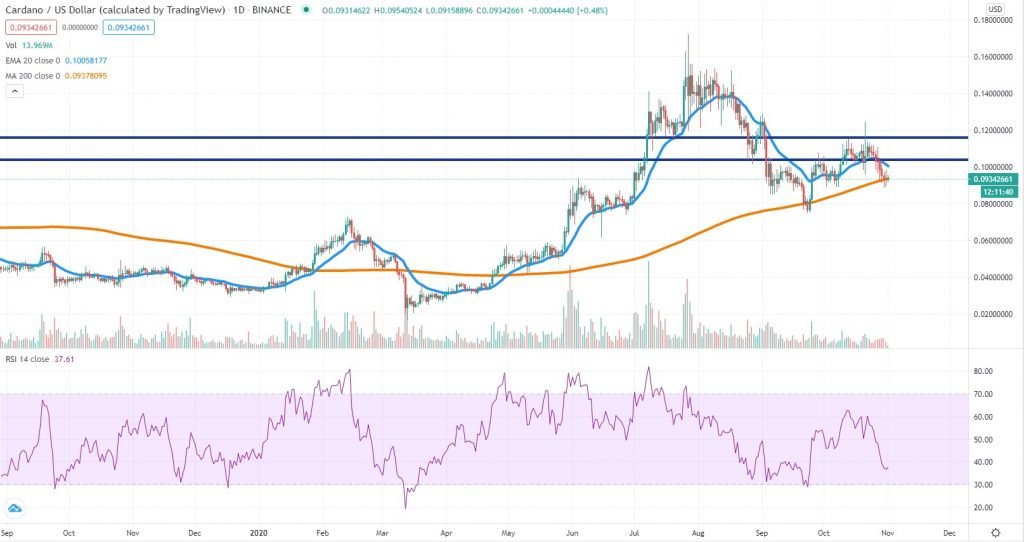
Even though the first half of the year had been positive for Cardano, not the same can be said about the performance since June. The price had been consistently under pressure and for the second time now we see it squeezed towards the daily 200 SMA.
That’s a critical support area and how the price develops in the next few days could be a key indicator for the next impulsive move. A breakout below would push ADA towards the 8 cents area, while support around the SMA will mean the 10 cents – 11.5 cents resistance area will be again revisited.
It seems like the price trades between those two areas and it will be important to monitor which side will manage to win the battle. At this point, the sellers are the ones in control, but the market mood could change at any point.


There are no comments at the moment, do you want to add one?
Write a comment