
BTCUSD Coinbase
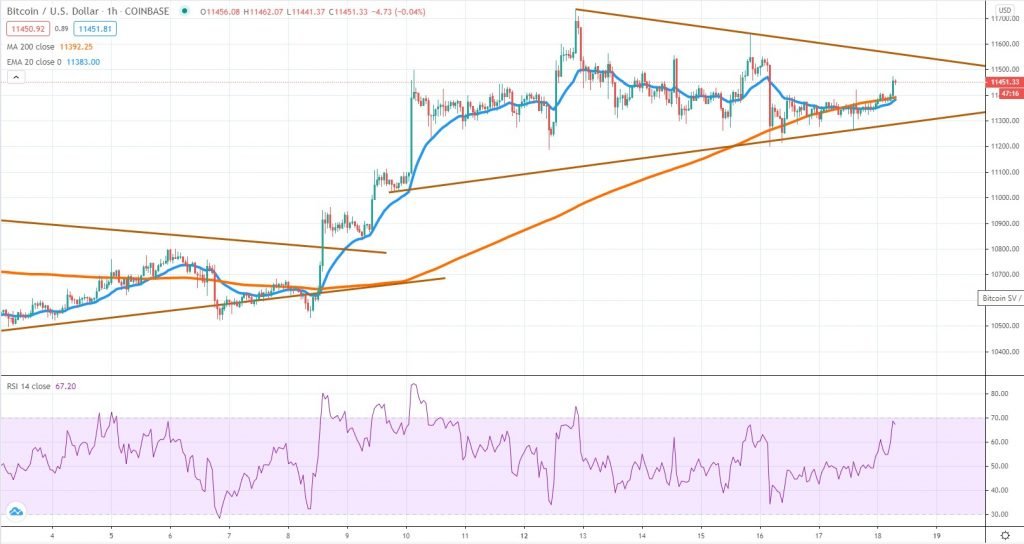
After breaking above a triangle formation impulsively, Bitcoin had managed to reach the $11,700 area, but since October 12th, it started to consolidate again in what seems like another triangle. Volatility had gradually dropped while the buyers are still in control short-term, considering the price had not managed to break below the 1h chart 200 SMA or 20 EMA.
With the RSI near overbought territory, we should expect to see more consolidating at the start of the new week, if anything unexpected does not occur. How the price will break the structure will determine the outcome of this short-term ascending leg that goes back to the beginning of September.
If buyers push the price above the triangle, then our $12,000 target will be the next important resistance area to watch. A break below will complicate things for bulls because that will mean the $11,000 support is the next area of interest. We advise our readers to also watch how the US dollar and global stock markets perform next week to get more insights into the broad risk sentiment.
ETHUSD Kraken
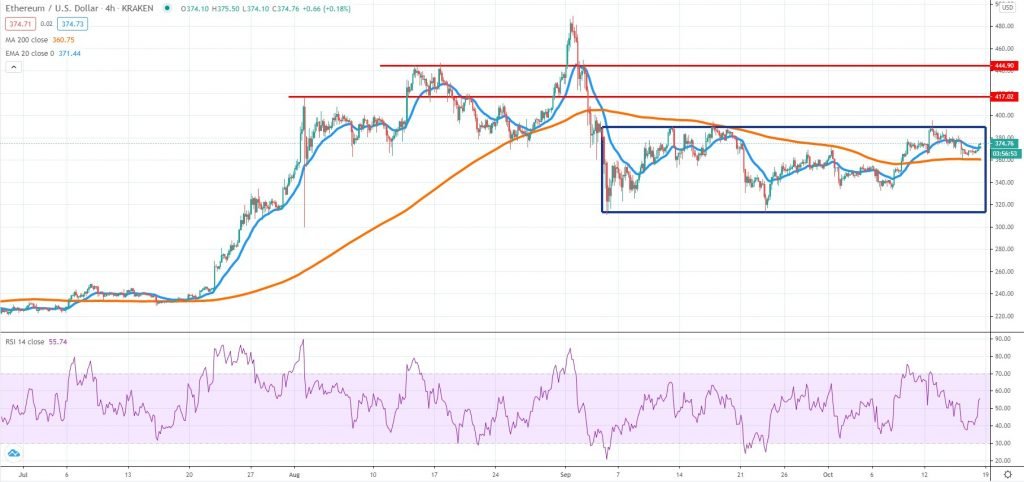
Since the beginning of September, the Ether price had been locked inside a range between $315 and $390, with neither bulls nor bears managing to drive the price outside the structure. The same thing happened on October 13th, when the price tested the top of the range, only to see sellers emerge afterward.
As long as the price continues to be located inside the structure, traders should play both sides of the market. In case pressure on either side will build up, then the likelihood of a breakout will increase. Breaking above the current October highs will be a short-term bullish signal, because that will mean move gains could follow, until $417 or $444.
However, looking at the bigger picture, the range can be treated as a consolidation after an impulsive selling move, which means Ether could be on the verge of a new impulsive selling move. Anything can happen at this point, which is why you should look at how key technical levels play out.
BCHSVUSDC Poloniex
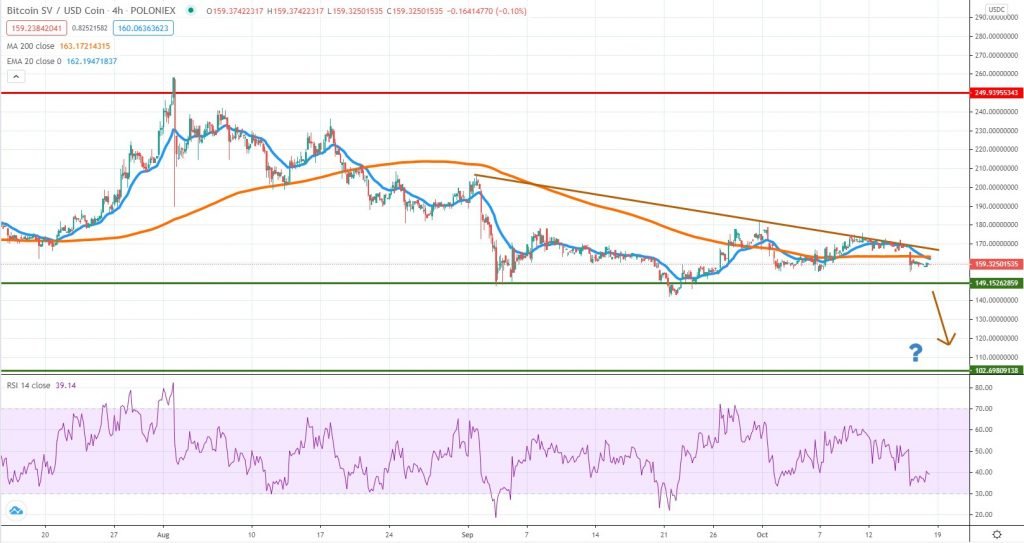
The activity on Bitcoin SV had been rather muted, but starting with September, we can see pressure building up on the token. More specifically, sellers are squeezing the price action towards the $149 support level, and given each bullish response is weaker, we assume that a breakout and continuation lower is the most likely scenario.
Breaking below the September lows, followed by a muted reaction from the buyers will be a key indicator for an impulsive move towards the key $100 psychological area.
On the upside, buyers will need to break above $180 to show some strength, but at this point, sellers continue to be in control. It would also be important to emphasize that due to its centralized nature, Bitcoin SV is subject to price manipulation, which means anything can happen in the next week. We stick to our near-term bearish outlook until the context will start to change.


There are no comments at the moment, do you want to add one?
Write a comment